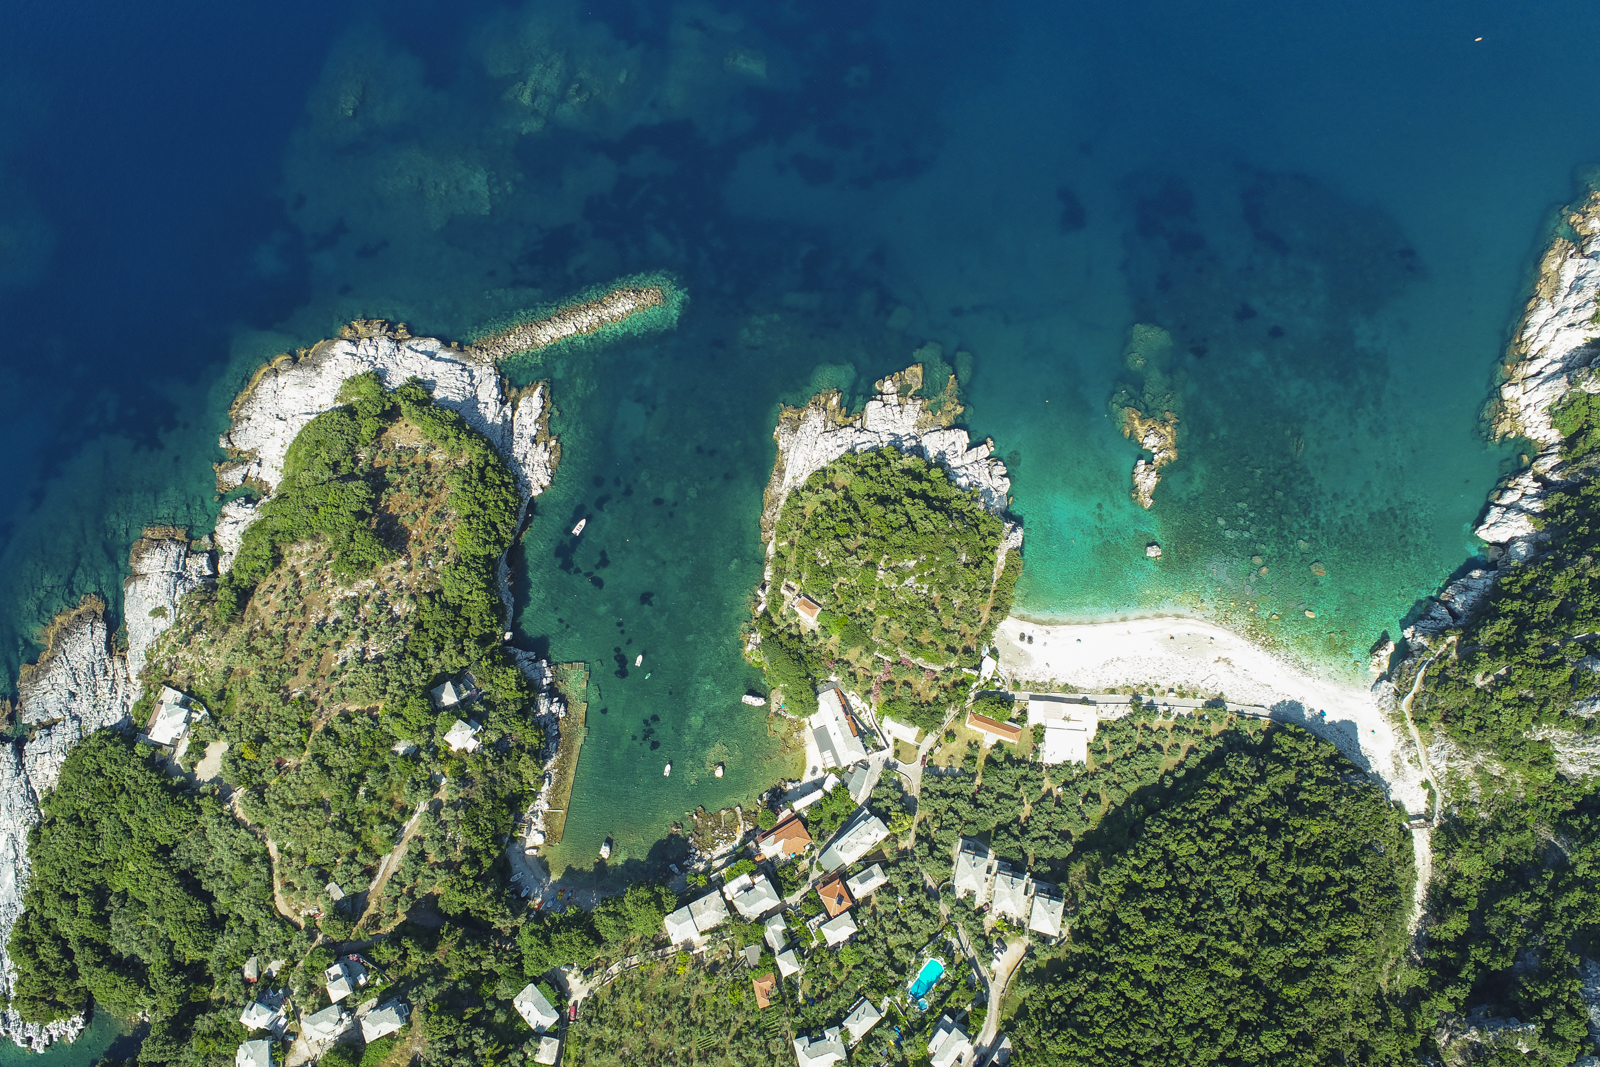
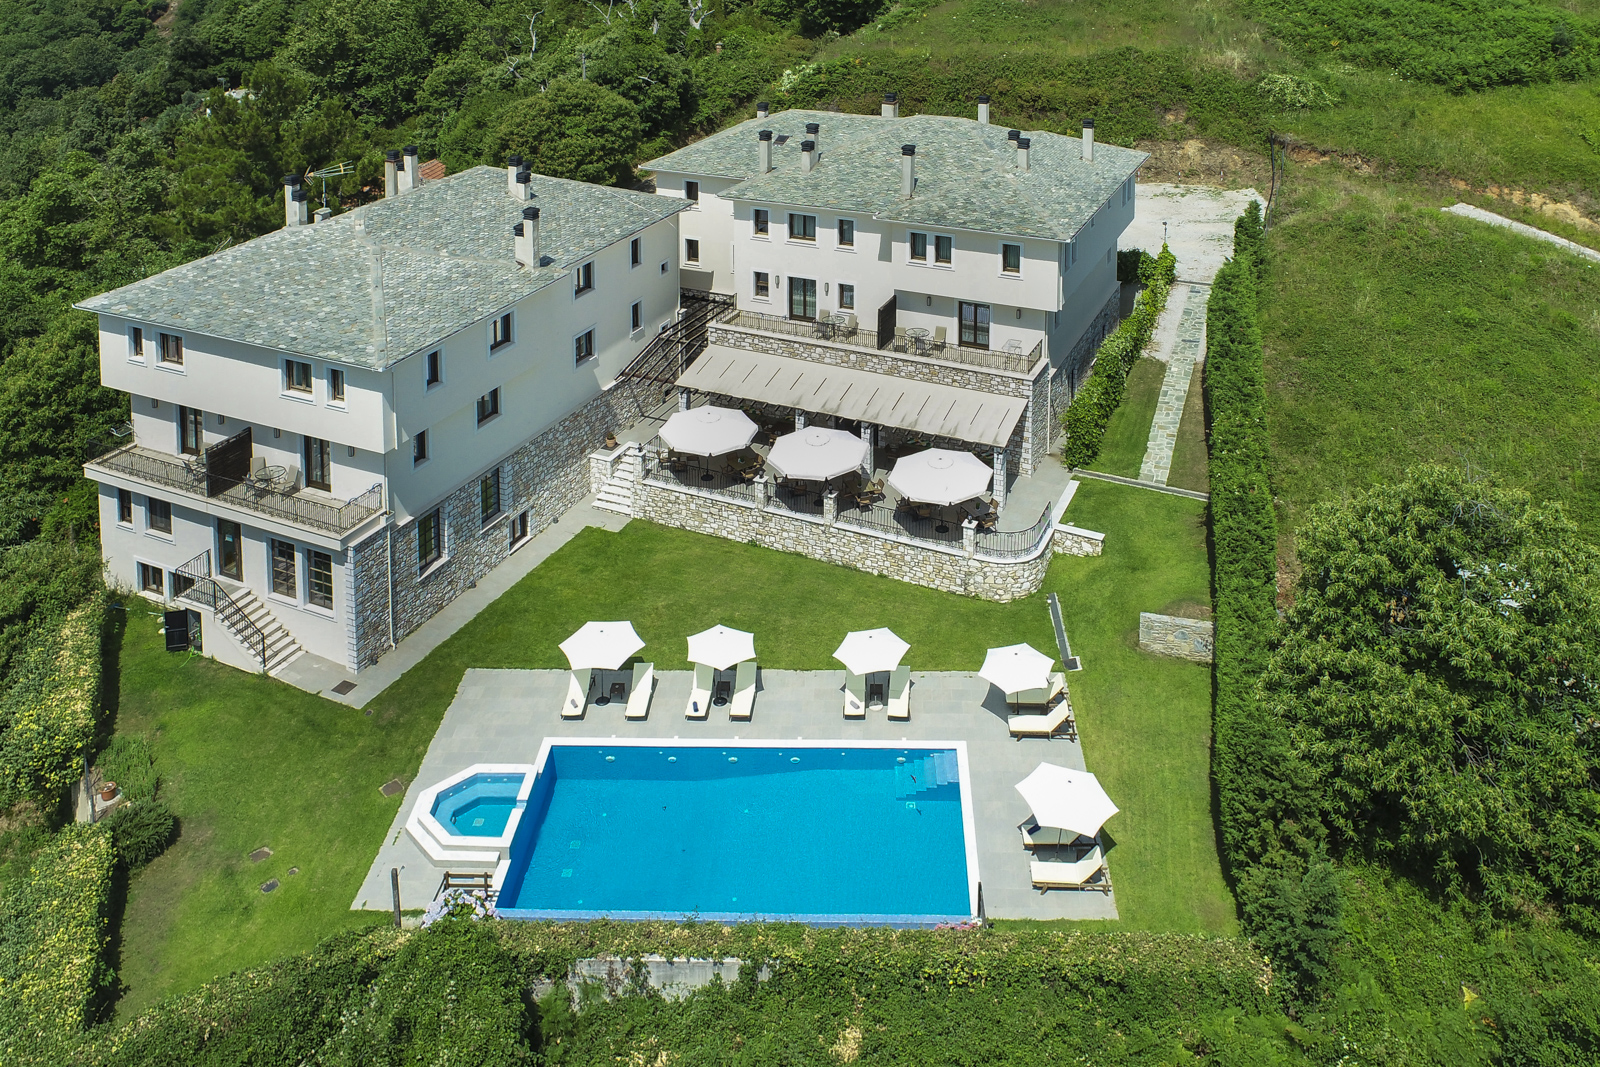
Drone RTK
Using the RTK Drone provides recording static images, video and morphological features, with an accuracy of 1 cm on 2-dimensional images (X + Y axels), usually used on large scale maps. It has also the capacity of creating 3-dimensional models with the same accuracy on the X + Y axels and 3 cm on the Z axel (hight). Those detailed measurements can be achieved by using a professional GPS, embedded on the RTK Drone, and the confirmation of position through a European subscription system of geodetic verification. The accurate measurements provide information for ground slopes, altitude differences, volumetric measurements, distance acreage measurements. All the above can be exported in point cloud files, RGB or grayscale altitude maps or with a photorealistic display using the photogrammetry technique. All data are processed using professional programs and can be delivered in a large variety of file types.
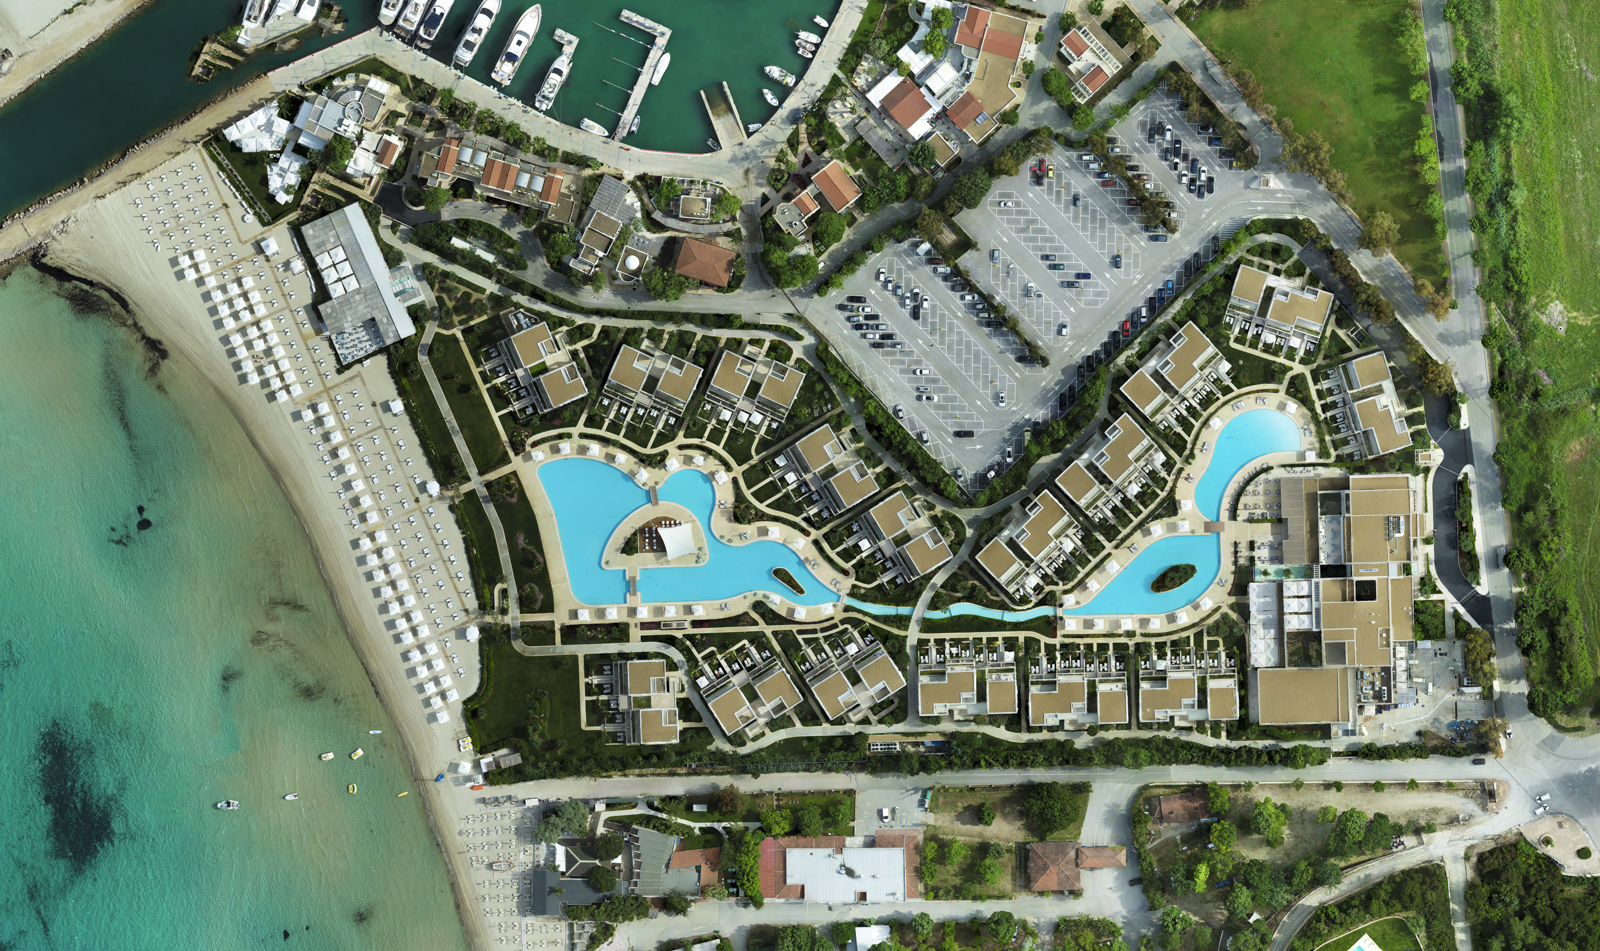
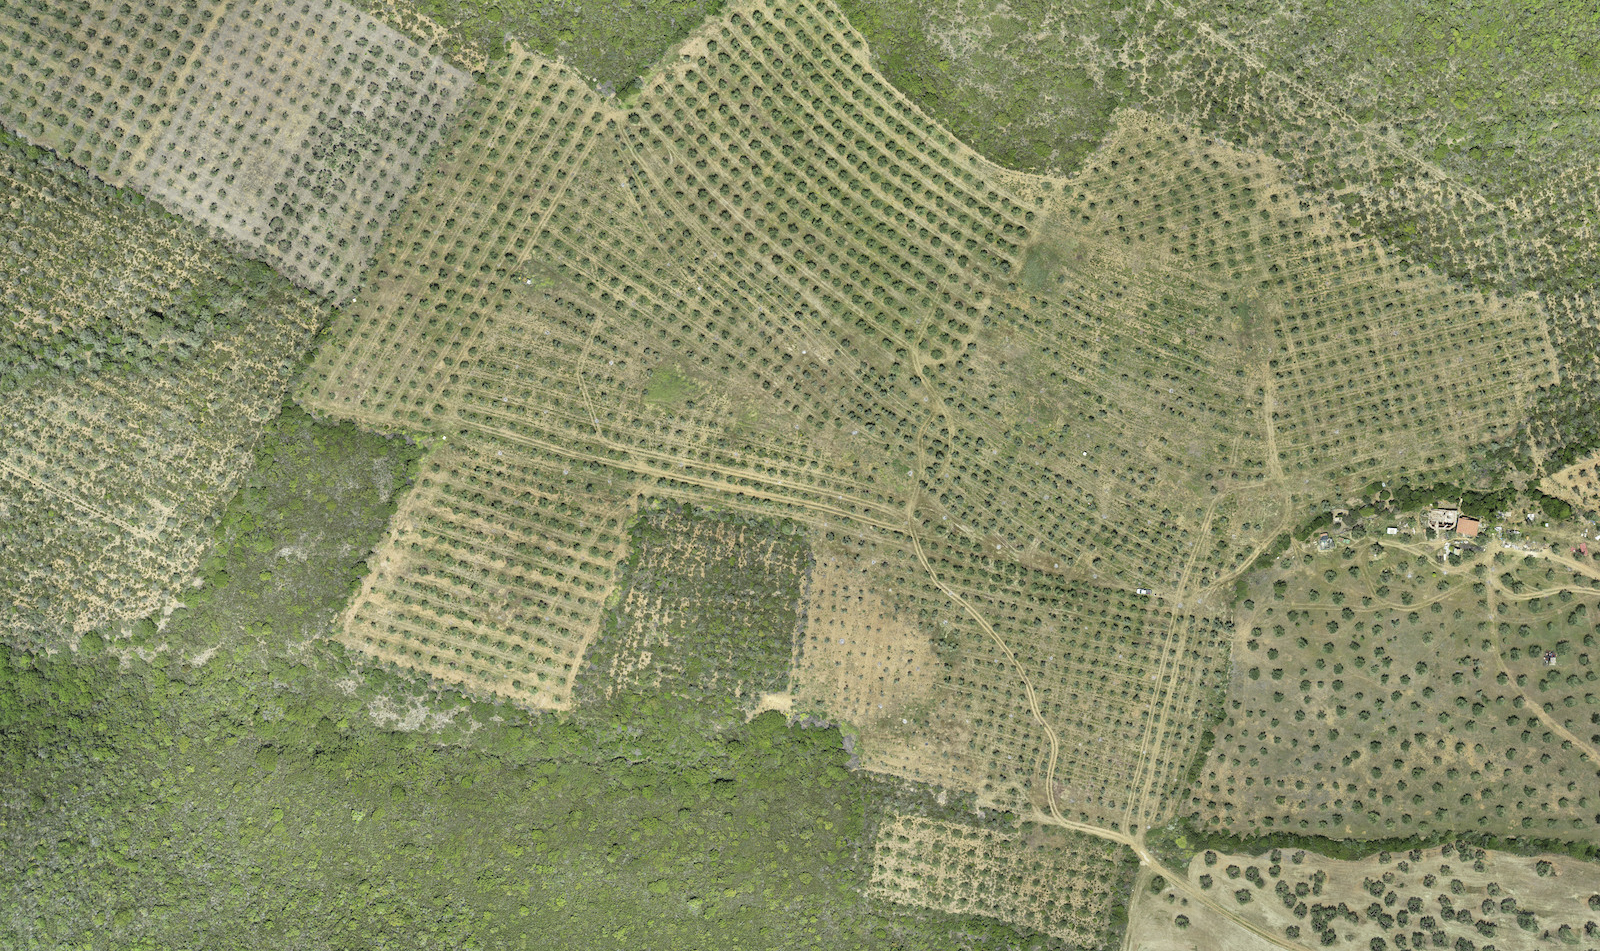
Examples number 1 - Orthomosaic 2d Mapping
Orthomosaic 2D mapping can be used to cover very large areas. This is accomplished by stitching thousands of photos thus creating a very detailed map. As a result we end up with a very high resolution image. The map created can be used for compering terrain changes, plant health, altitude models and measurements, volumetric data, area and distance measurements ,as well as traditional geolocation maps.
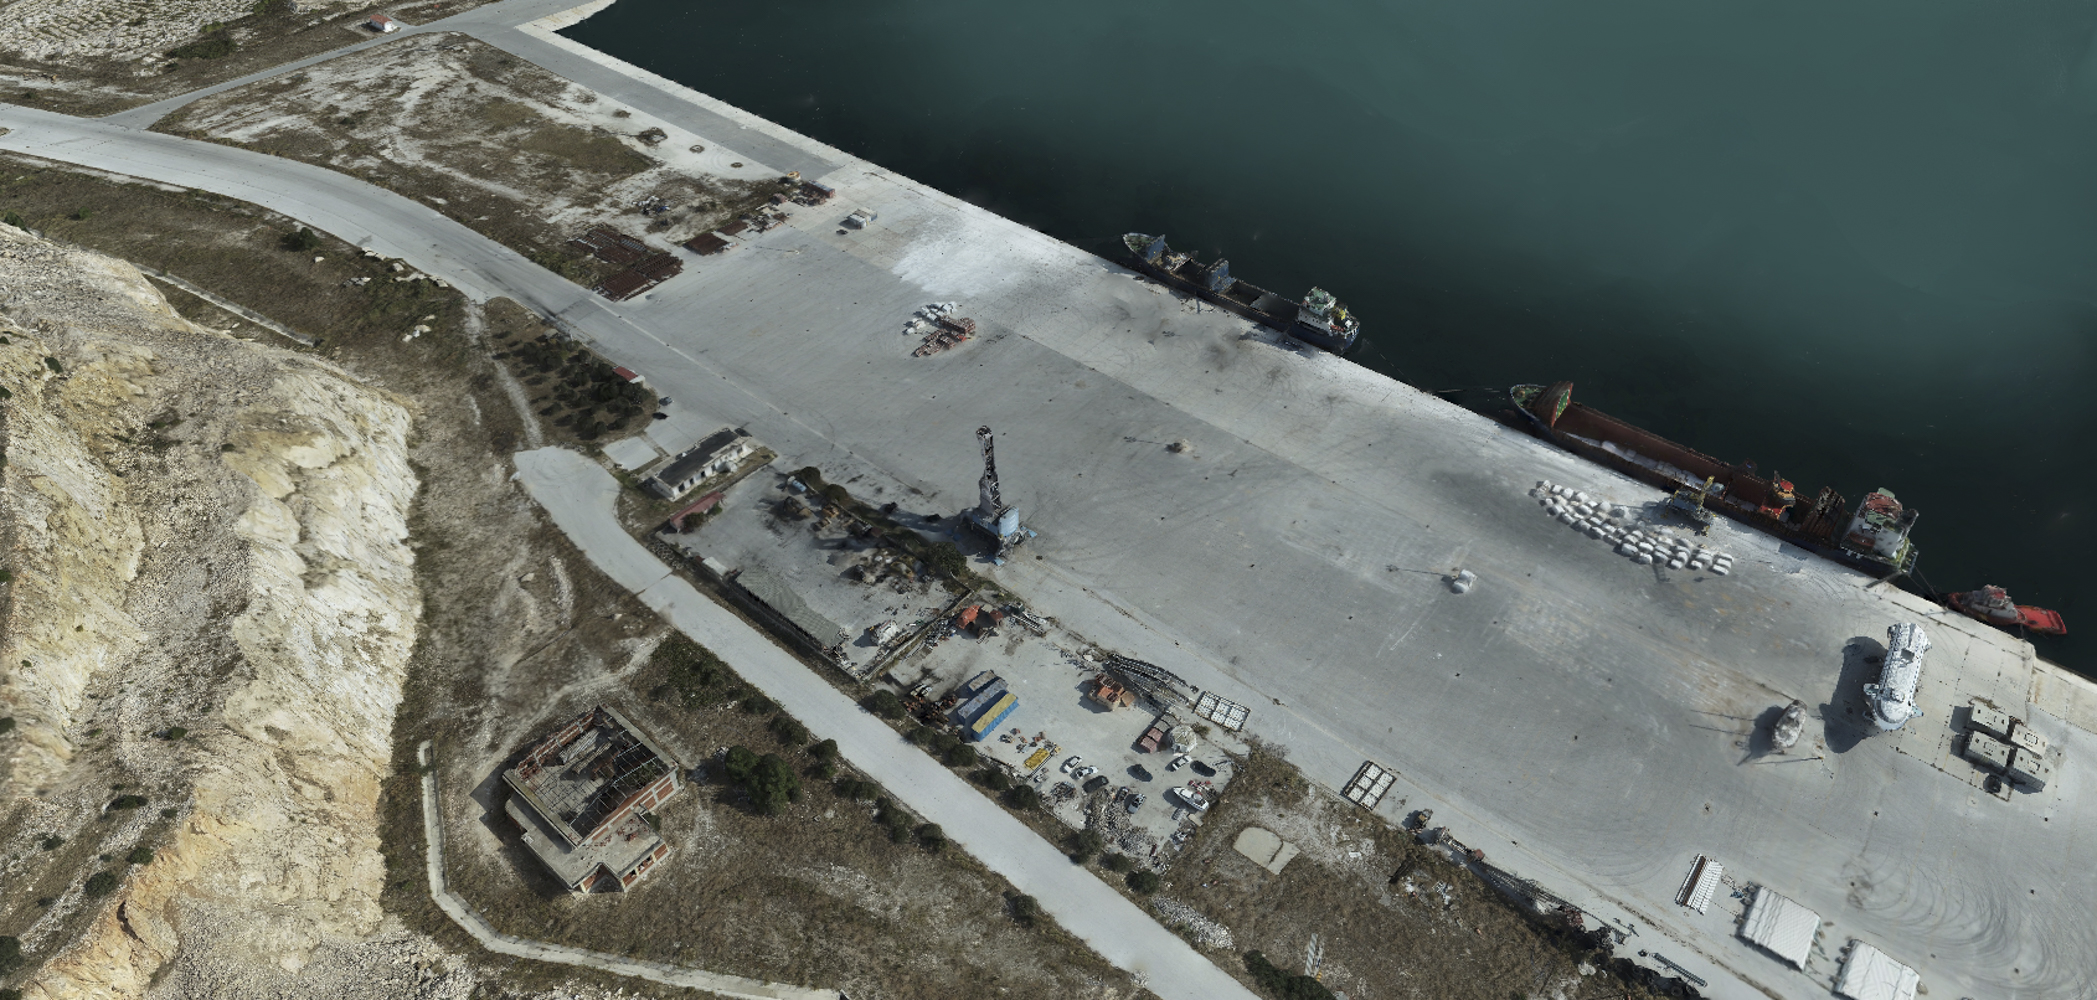
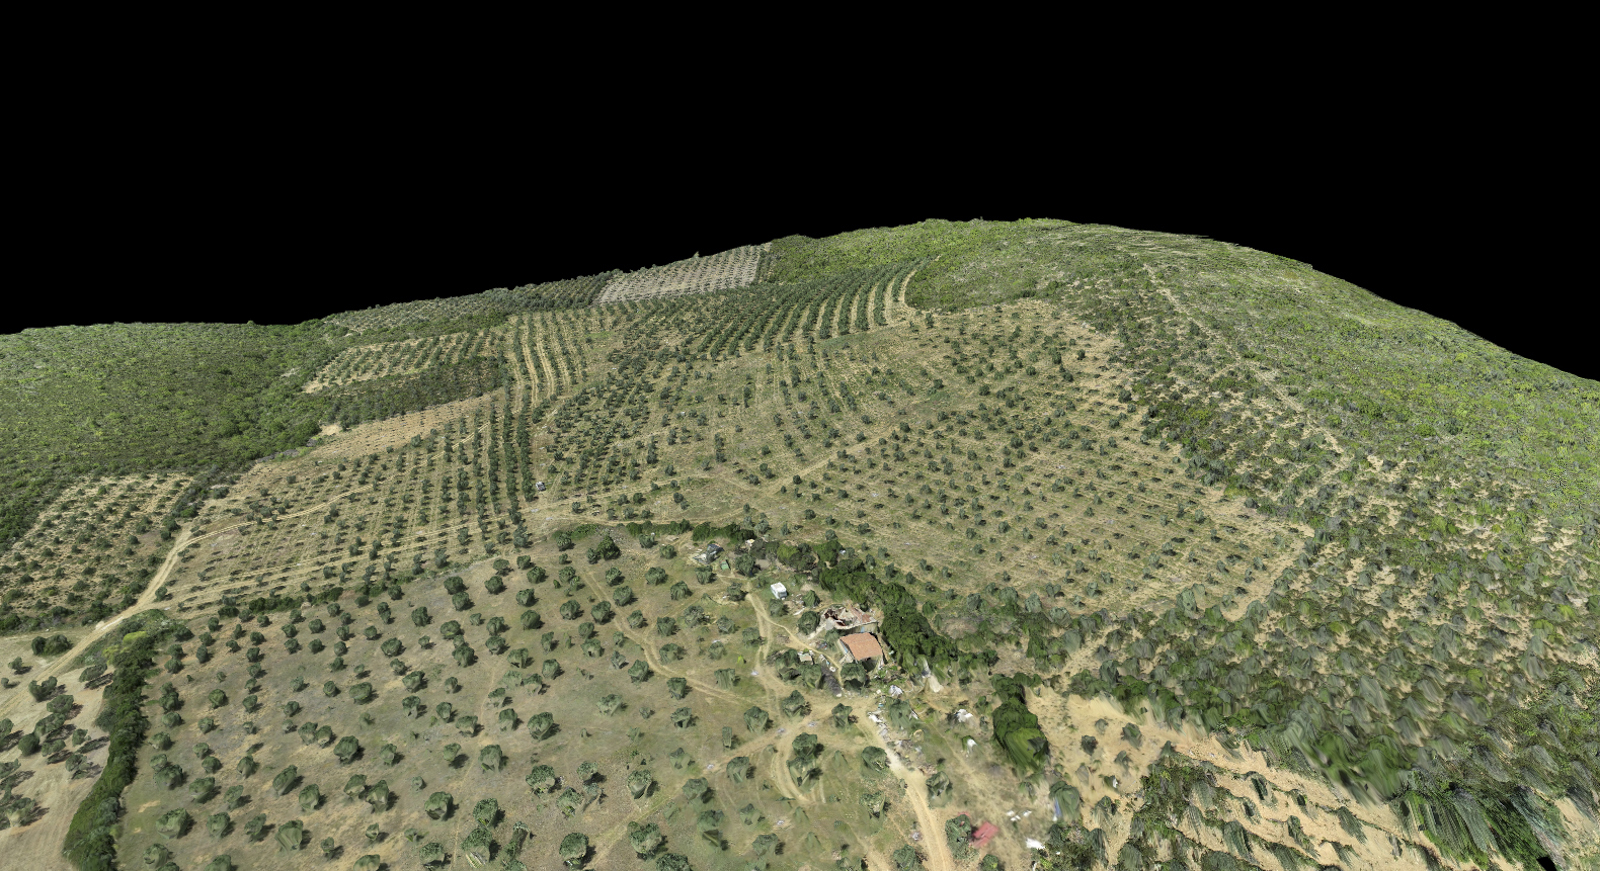
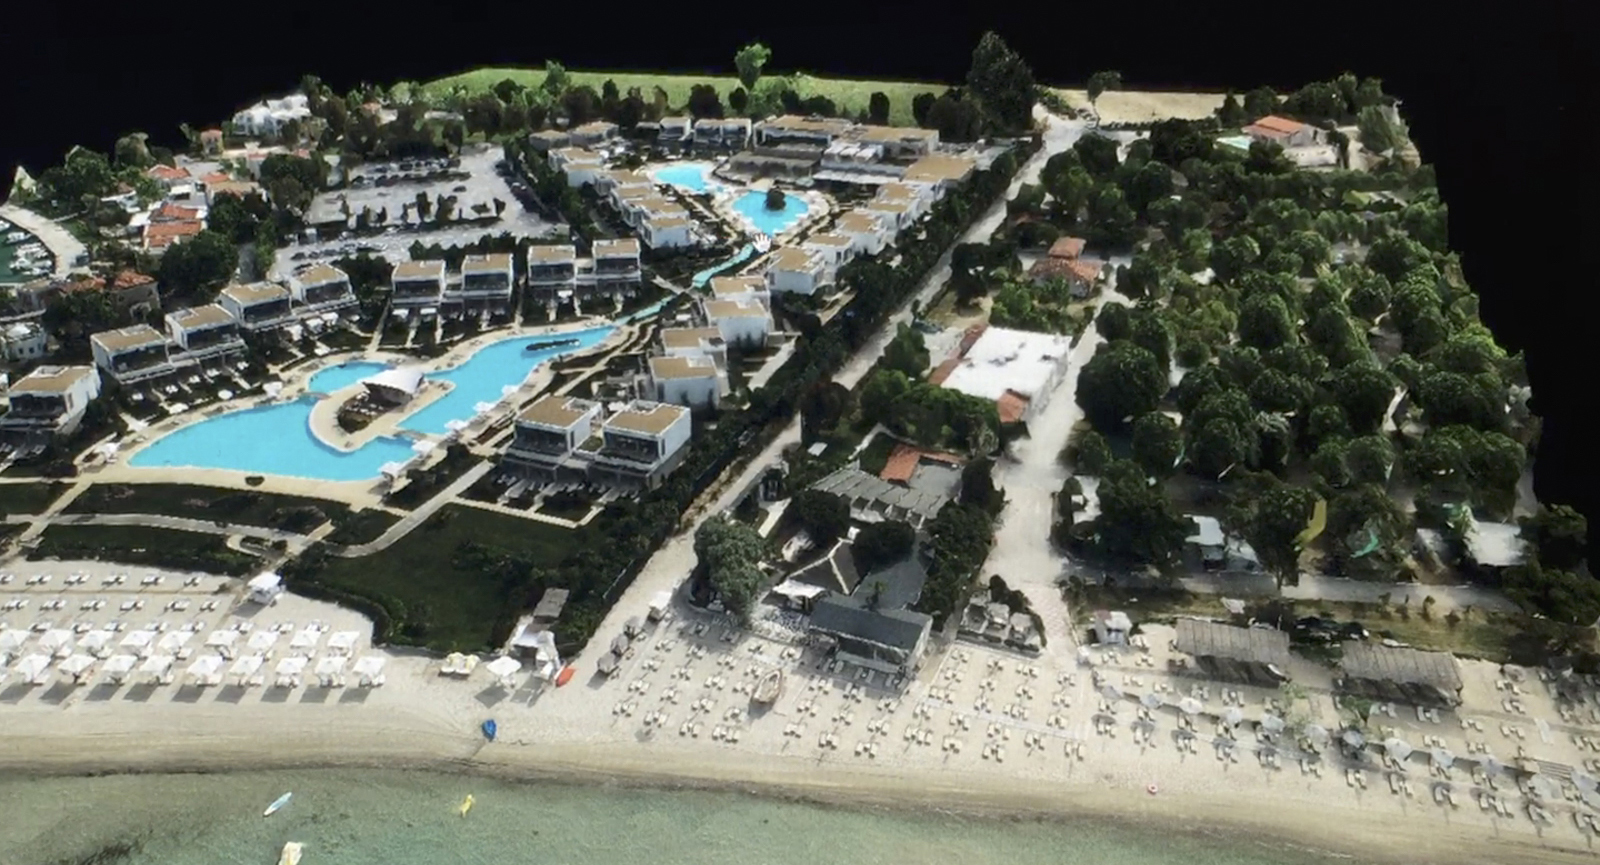
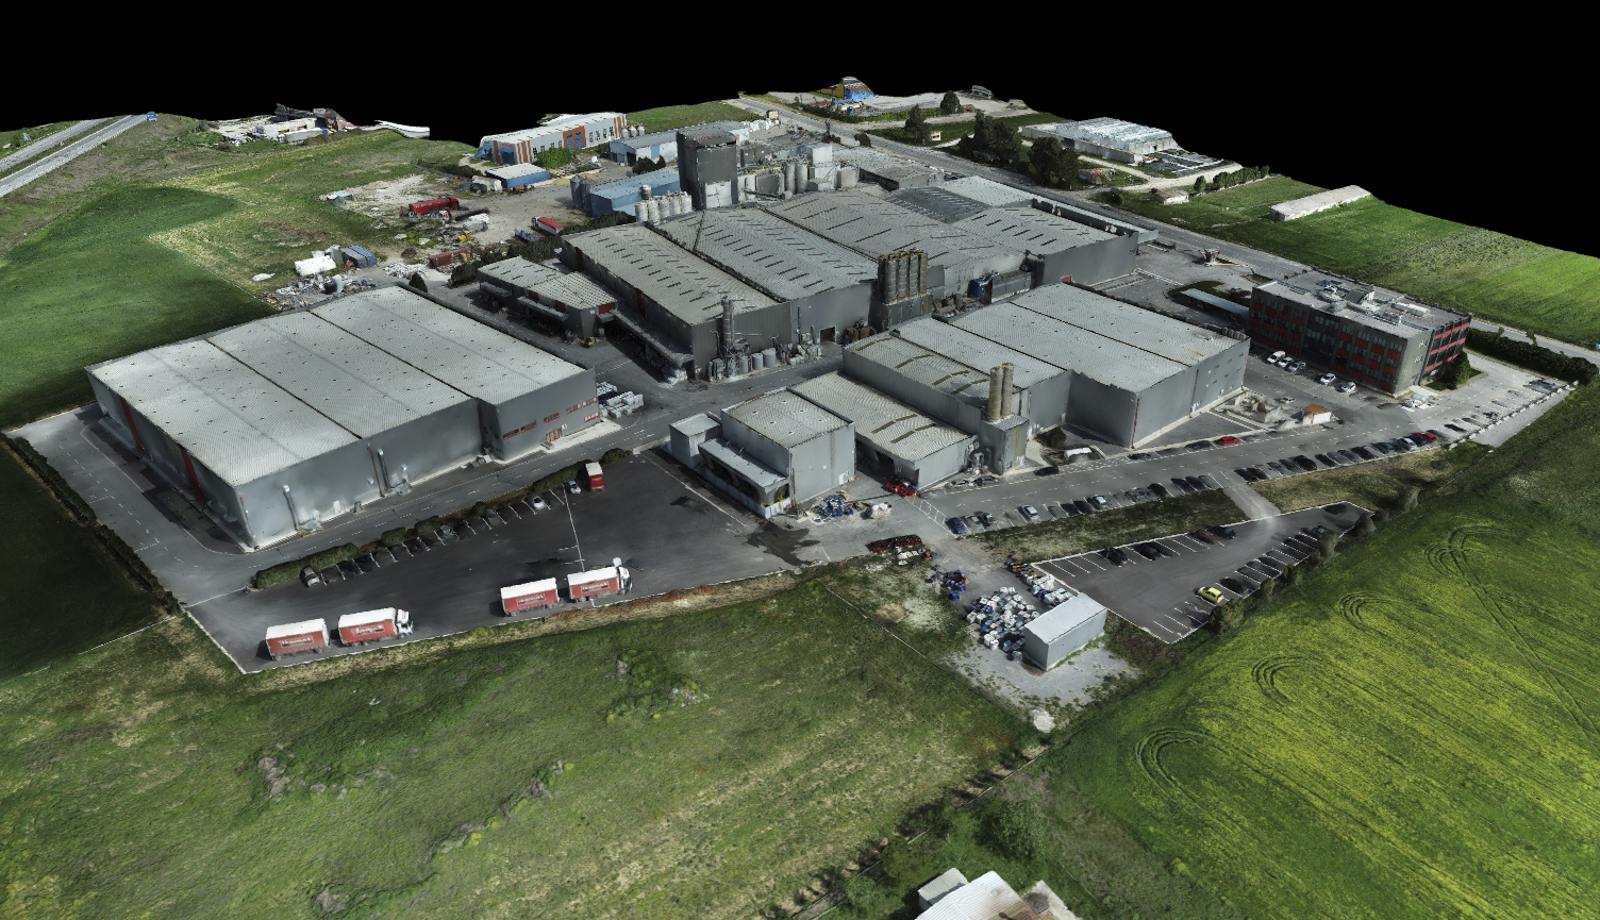
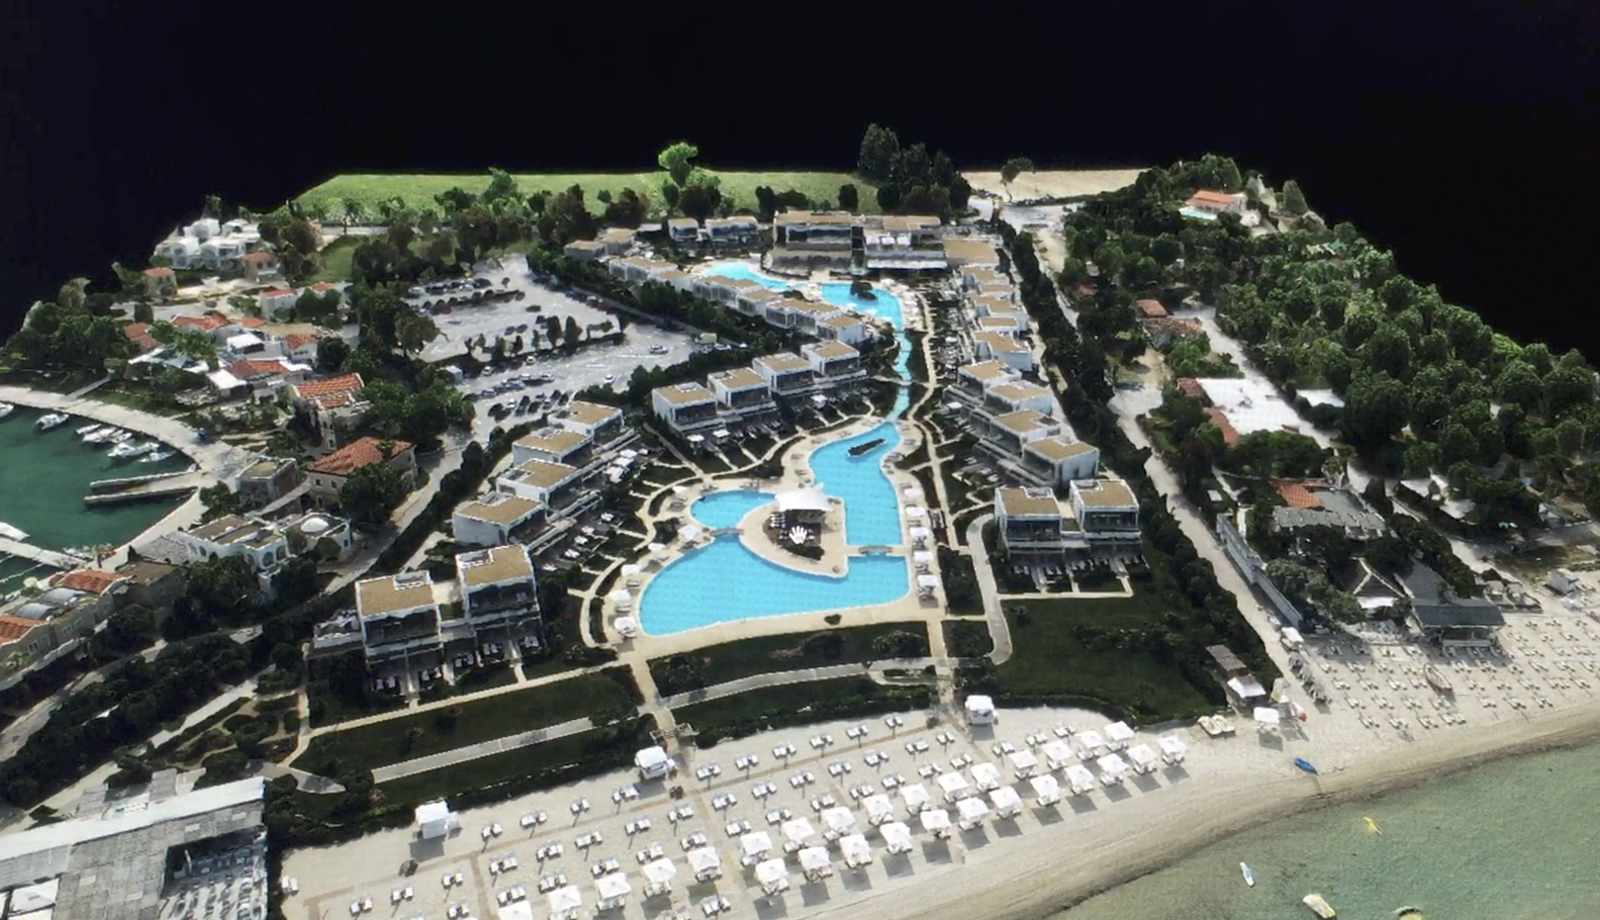
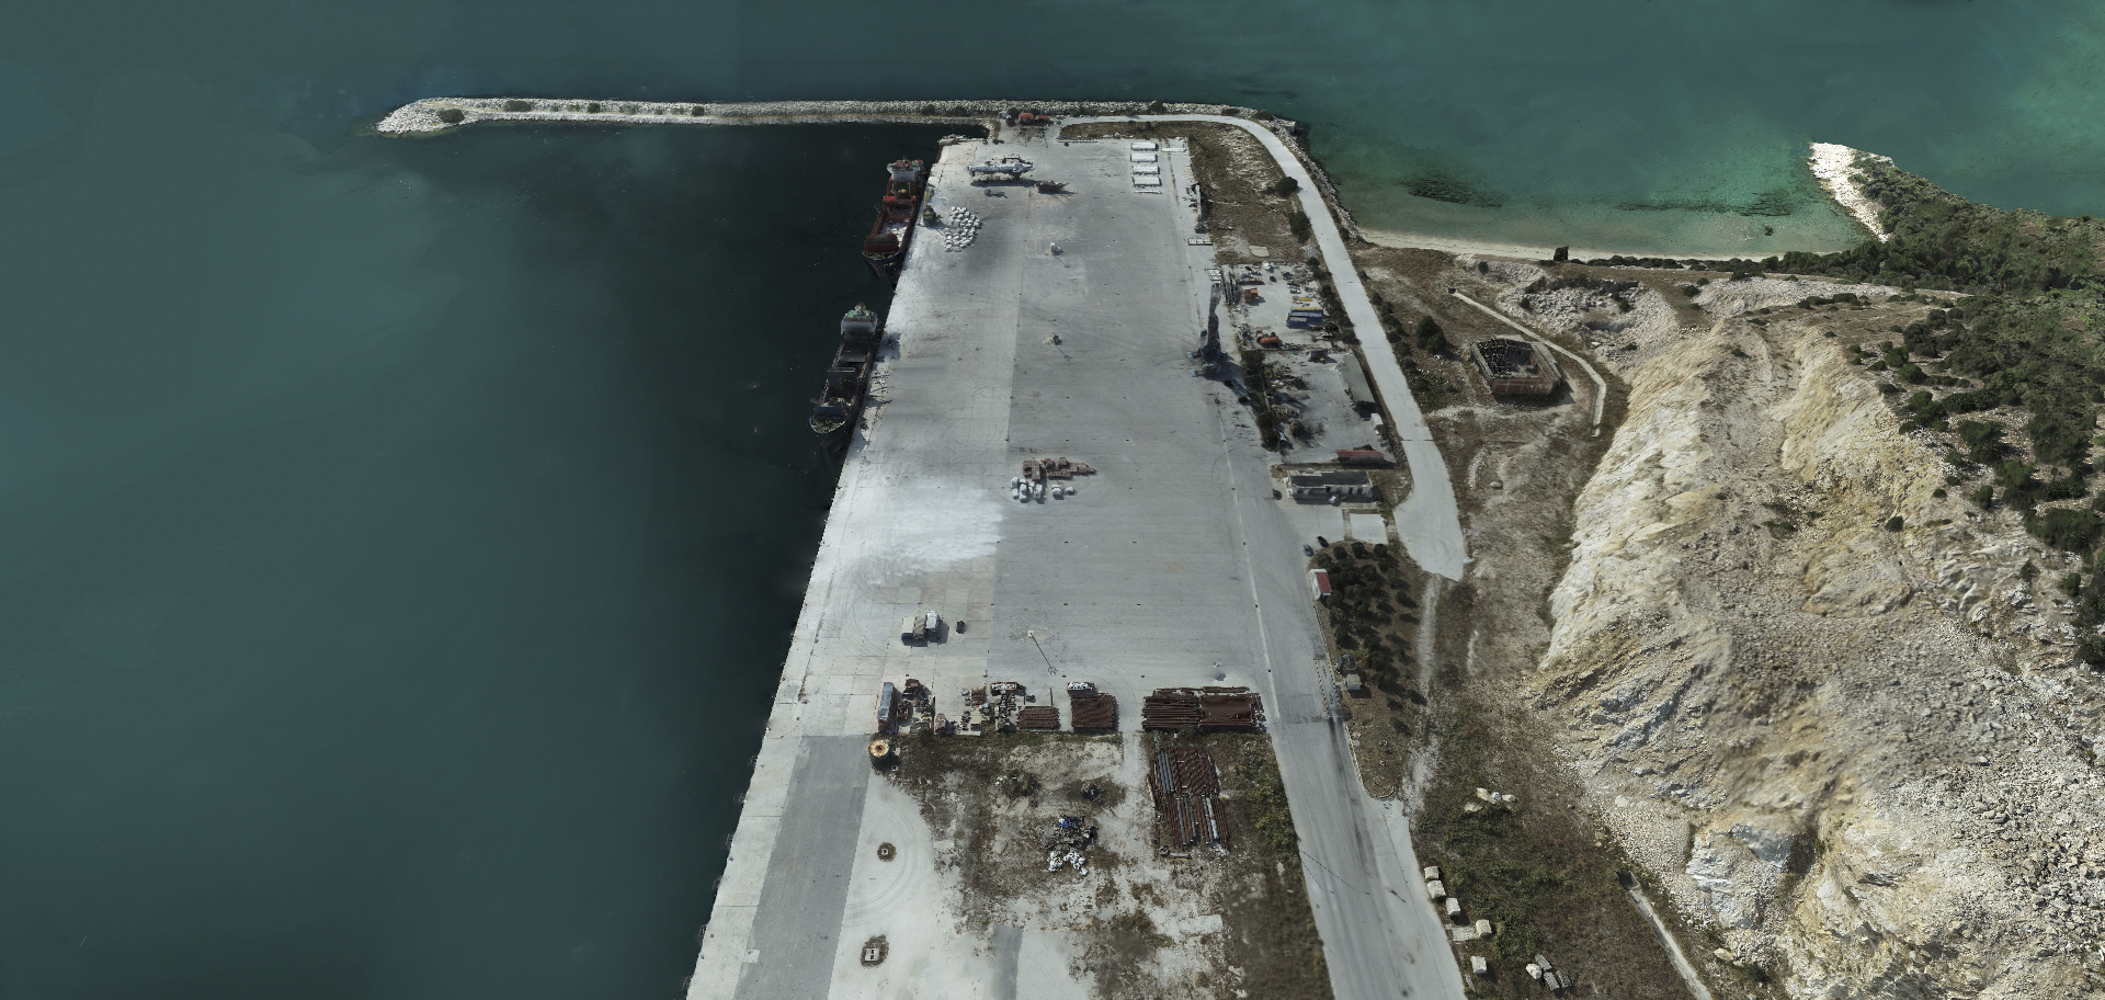
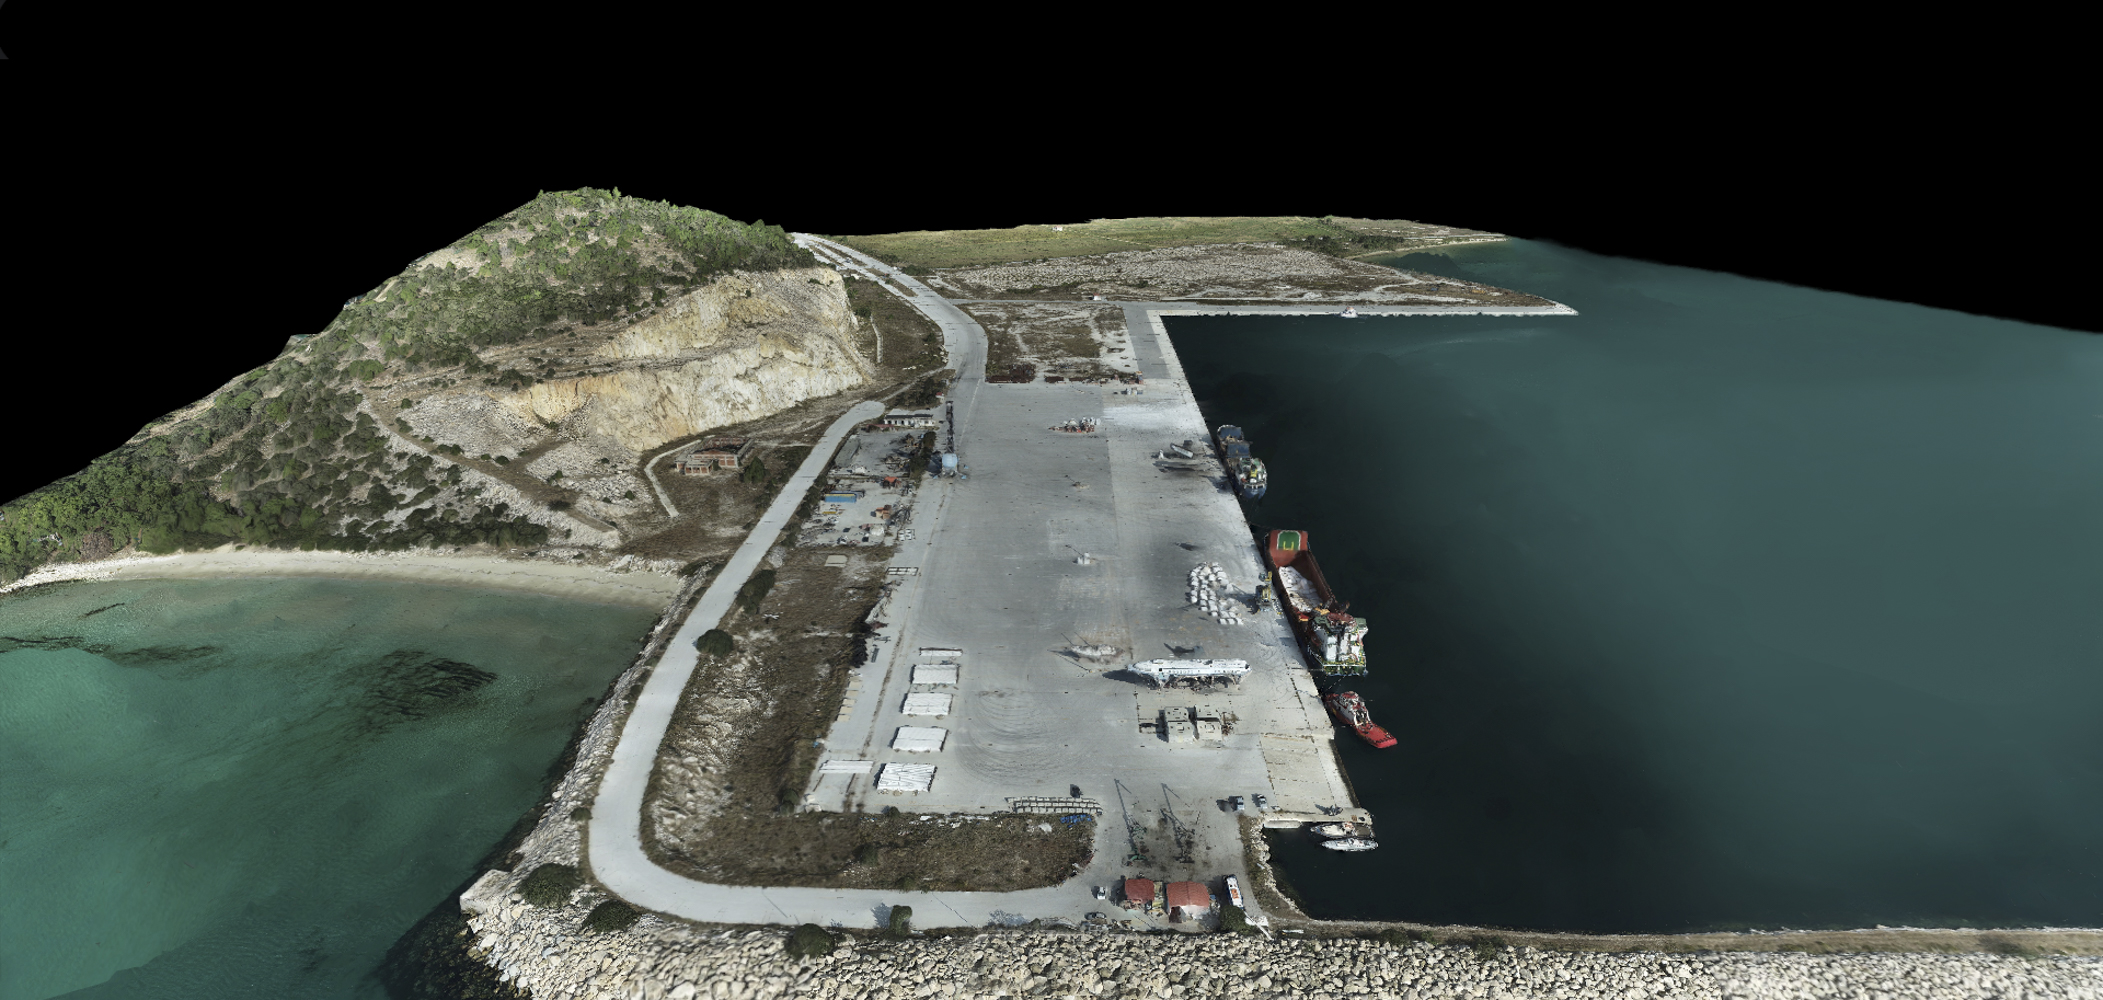
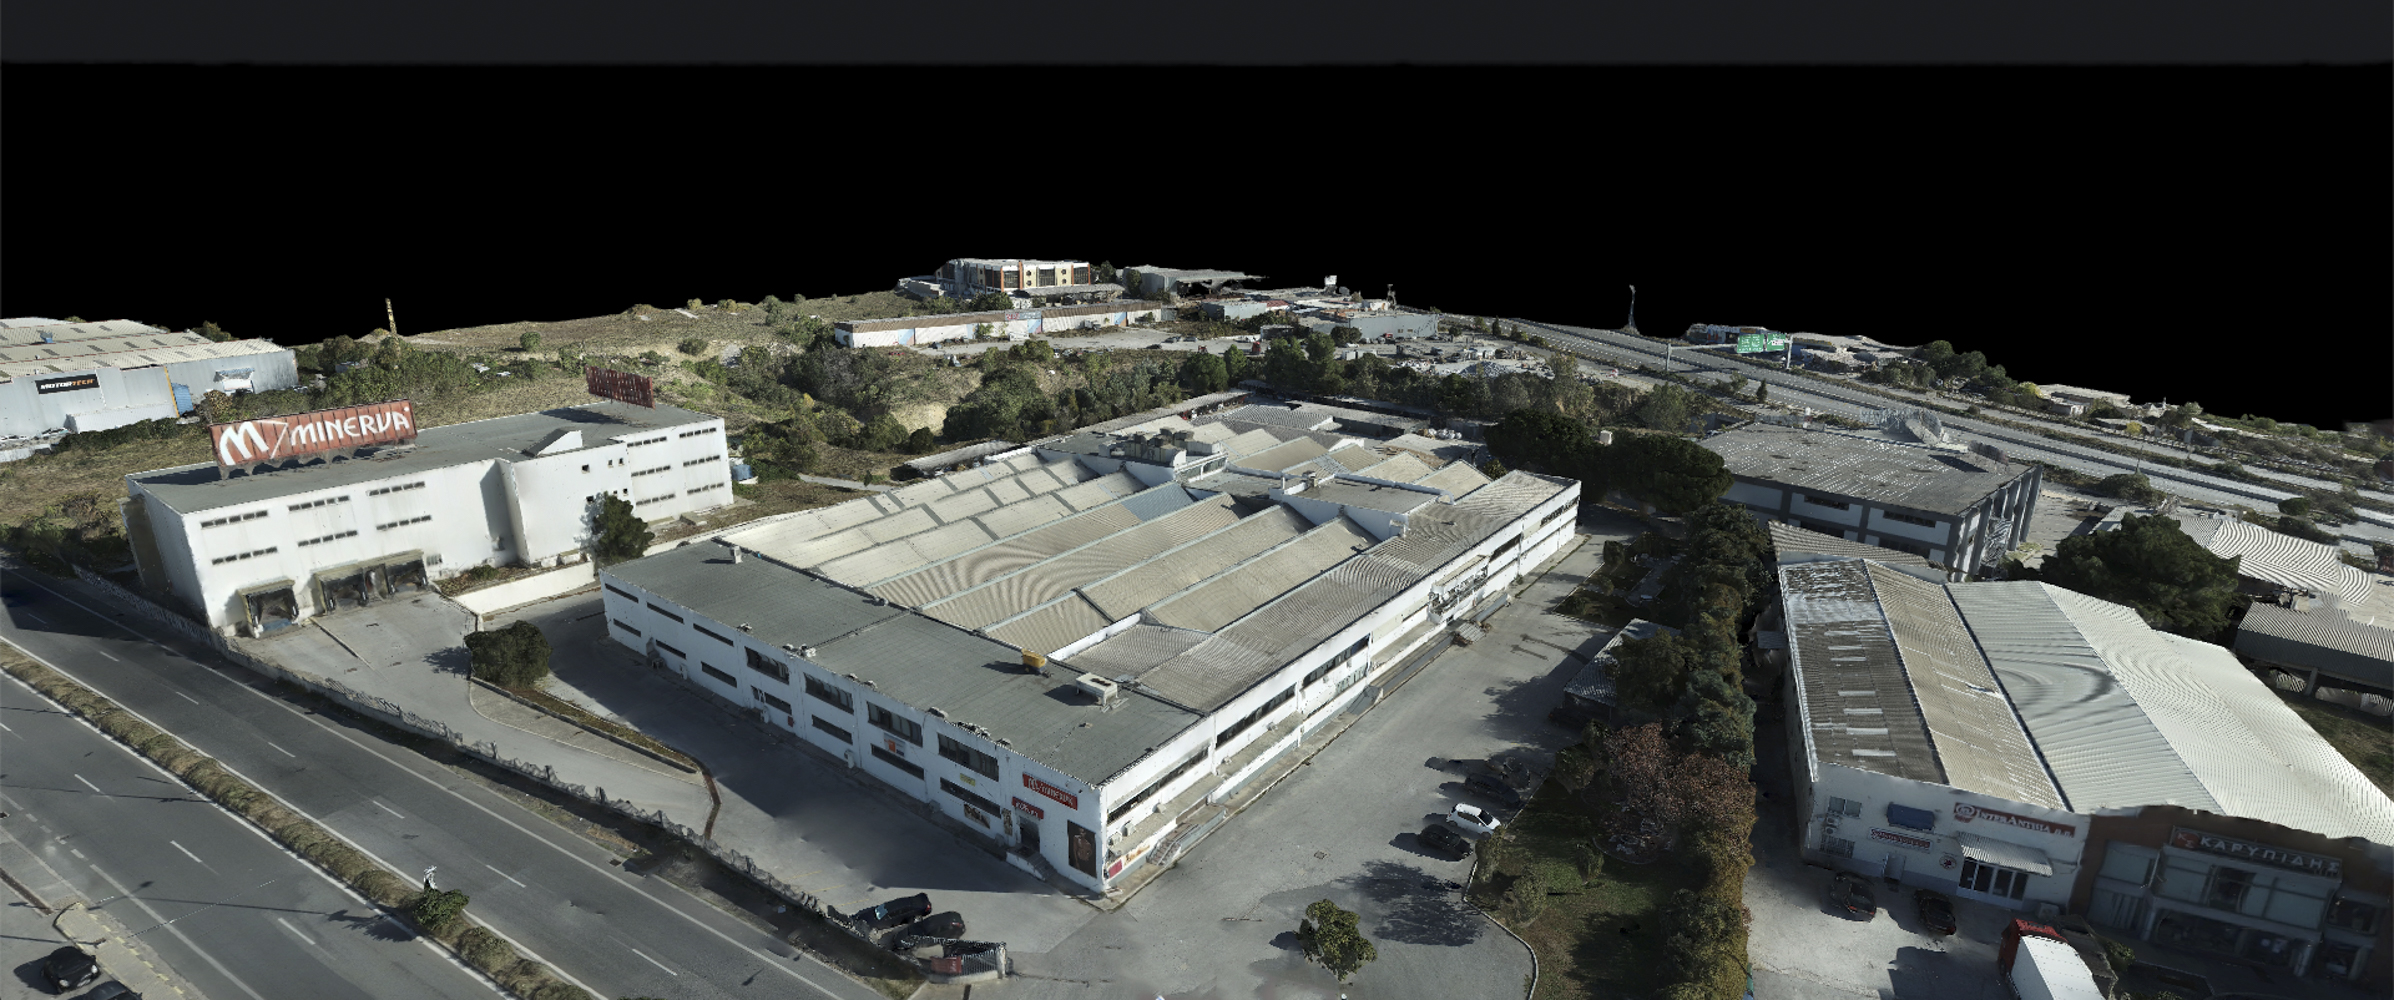
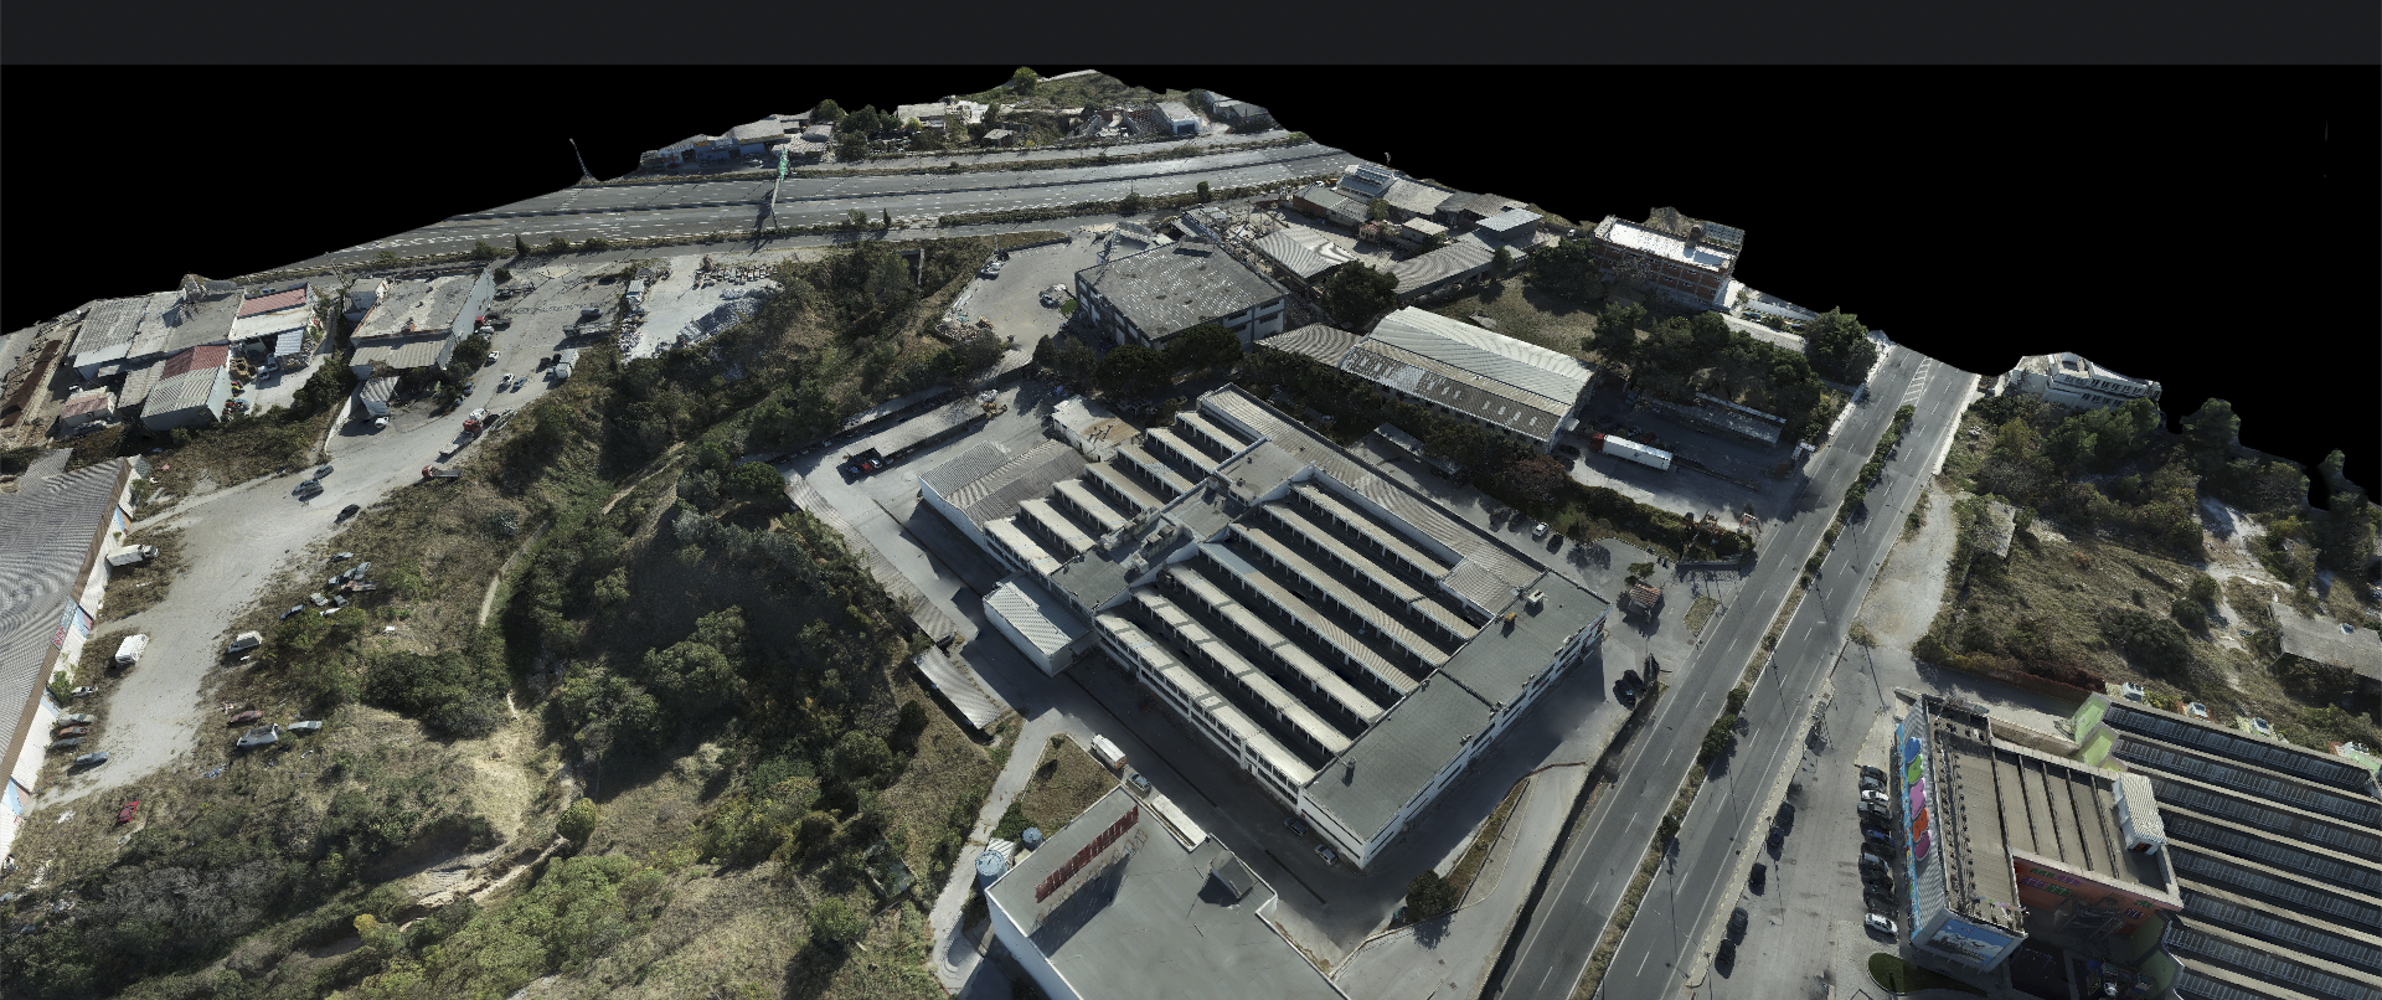
Examples number 2 - 3D Mapping
3D Mapping has all the benifits of 2d mapping but can also be used for presentations and a better understanding of the terrain dipicted.
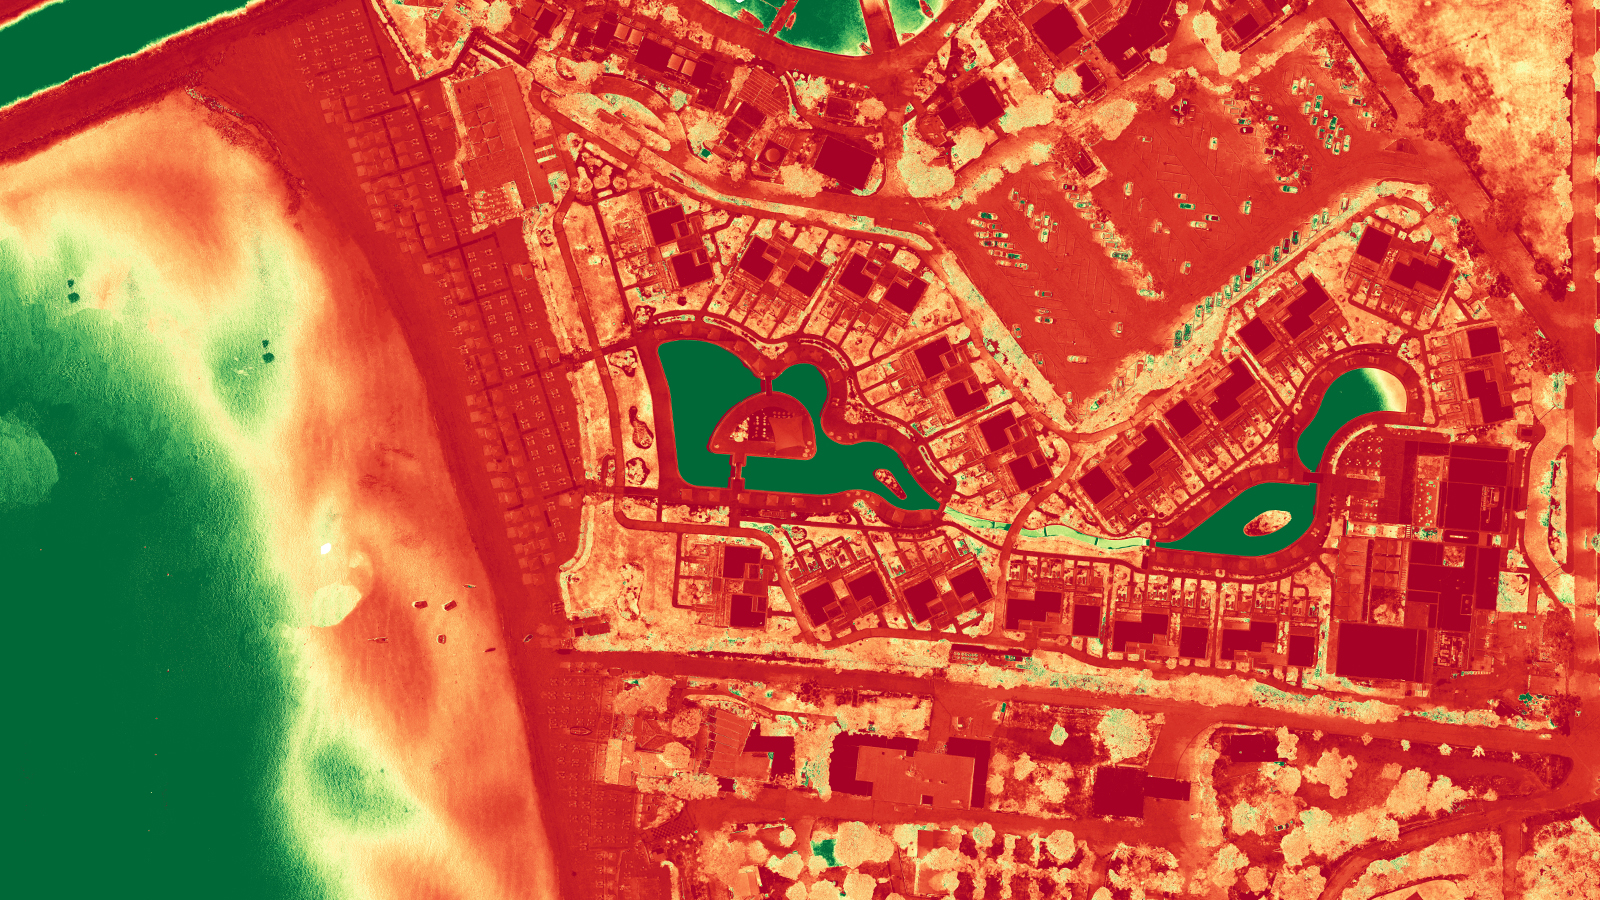
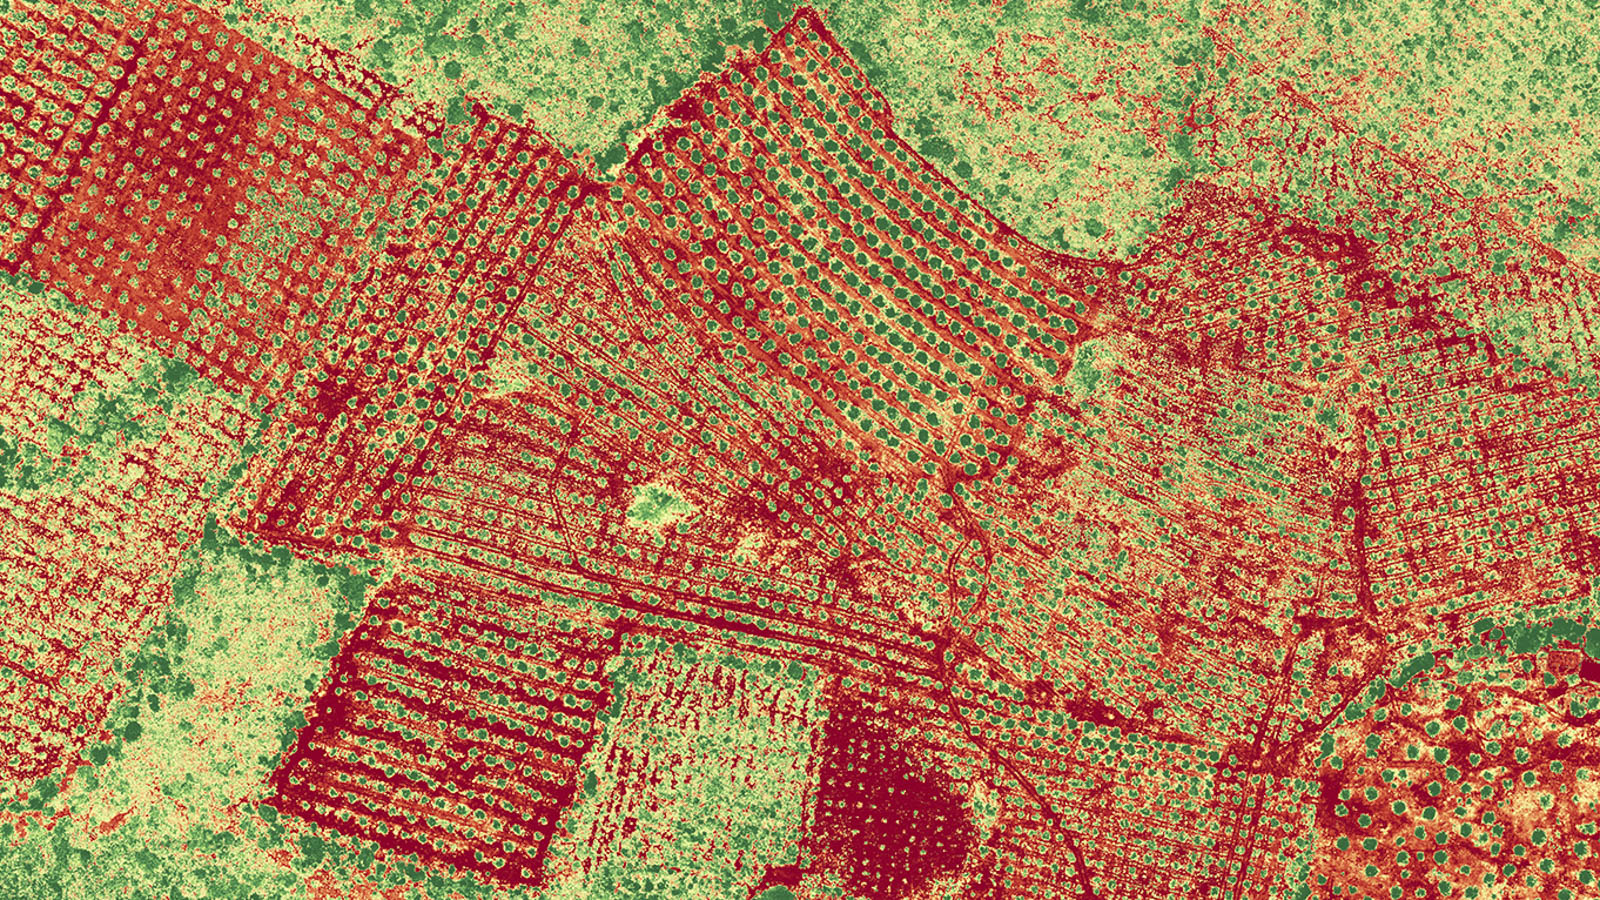
Examples number 3 - NDVI (Normalized difference vegetation index)
NDVI is one of the most popular vegetation indices. It is an indicator of vegetation healt based o how plants reflect certain ranges of the electromagnetic spectrum. The relationship between light and chlorophyll is how we can tell apart a healthy plant from a diseased one. NDVI can be used for targeted field analysis, plant population report, stand count report, weed analysis, pest damage, disease detection and pipe leakages and evaluation of irrigation.
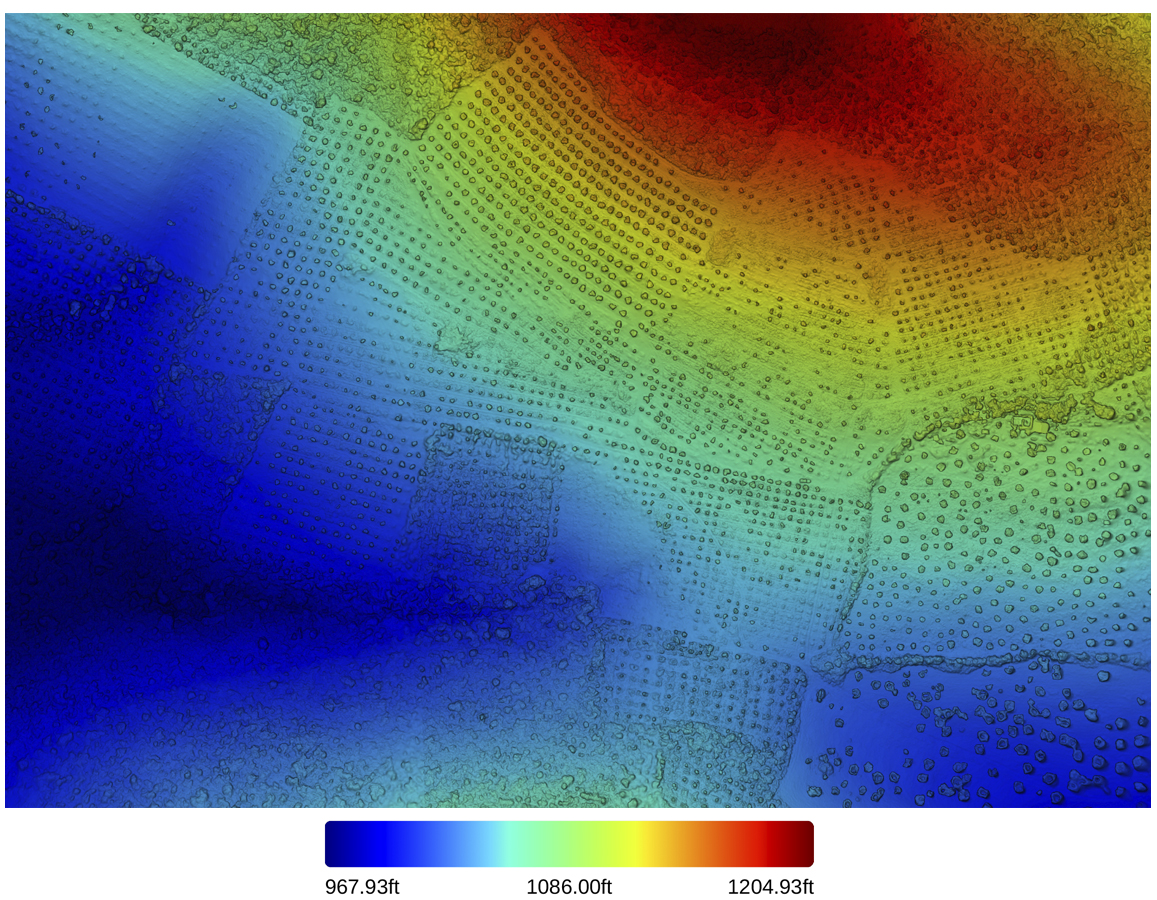
Examples number 4 - DTM (Digital Terrain Model)
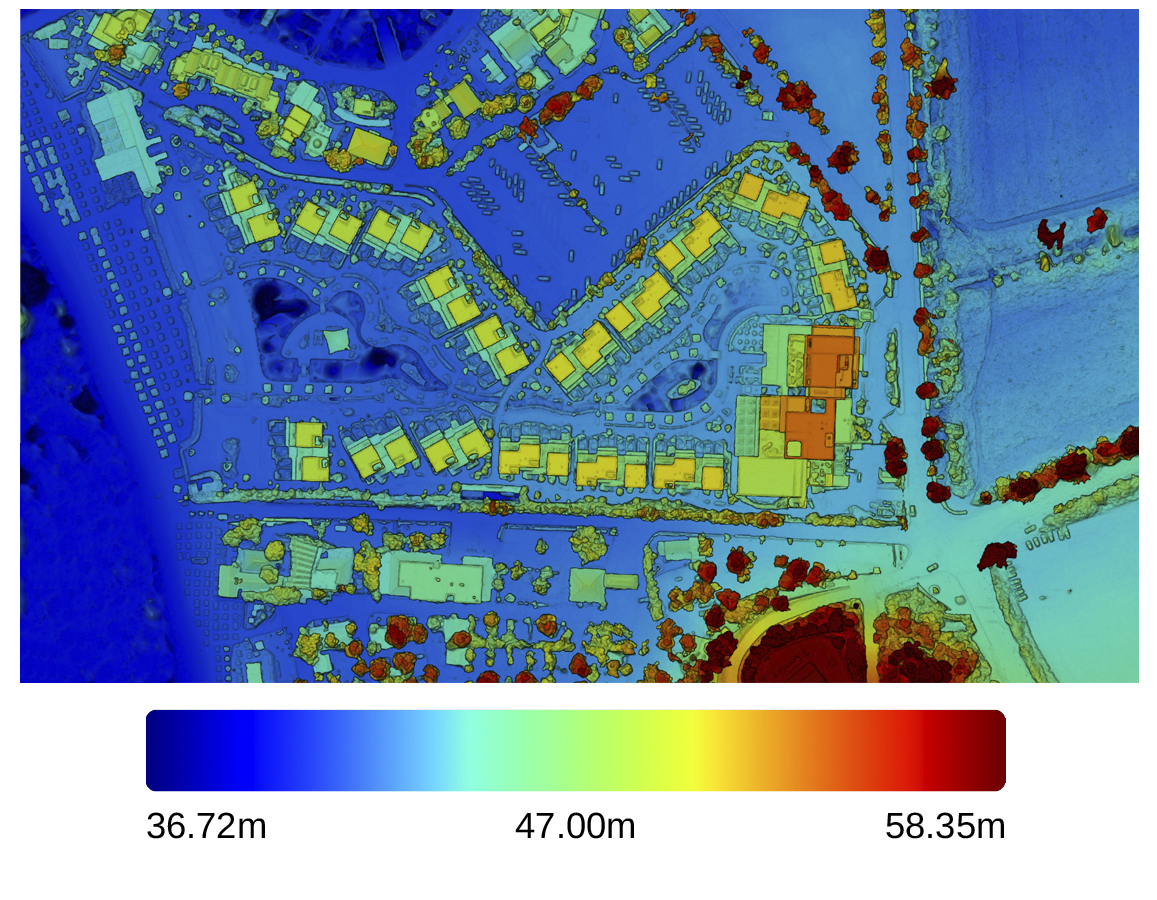
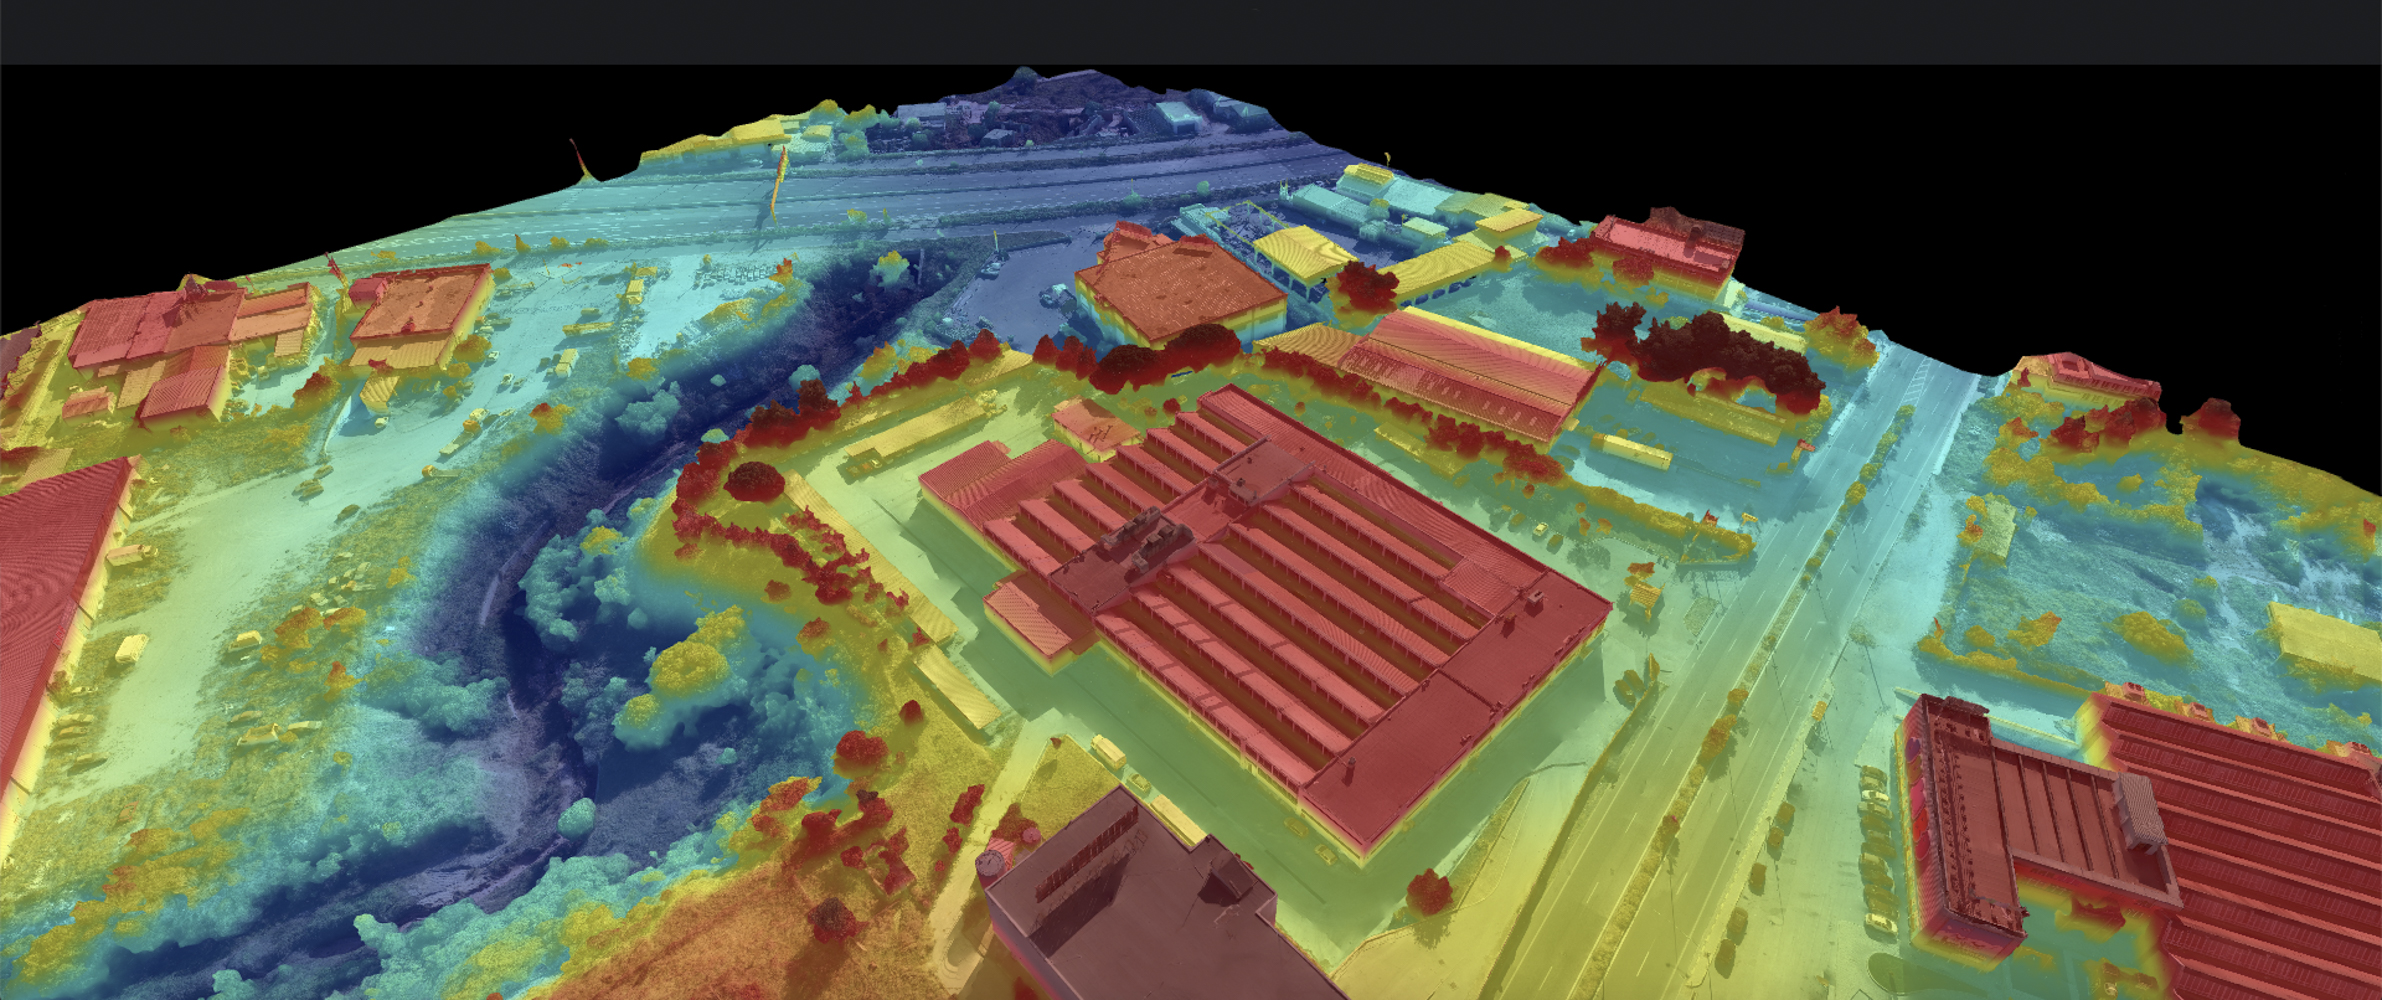
Elevation maps is a very useful tool for visualizing and understanding terrain. Using (RGB) color profile we can easily read altitude fluctuations. Dark blue color is used for the lowest and deepest parts of the terrain, such as gorges, ravines and sedimentations. red from the other side used to show higher altitudes, like peaks, slopes, tree and roof tops. Using DTM we can define and locate fast, places susceptible to floods, plan routs for water irrigation systems, manage insecticides, pesticides and water in accurately.
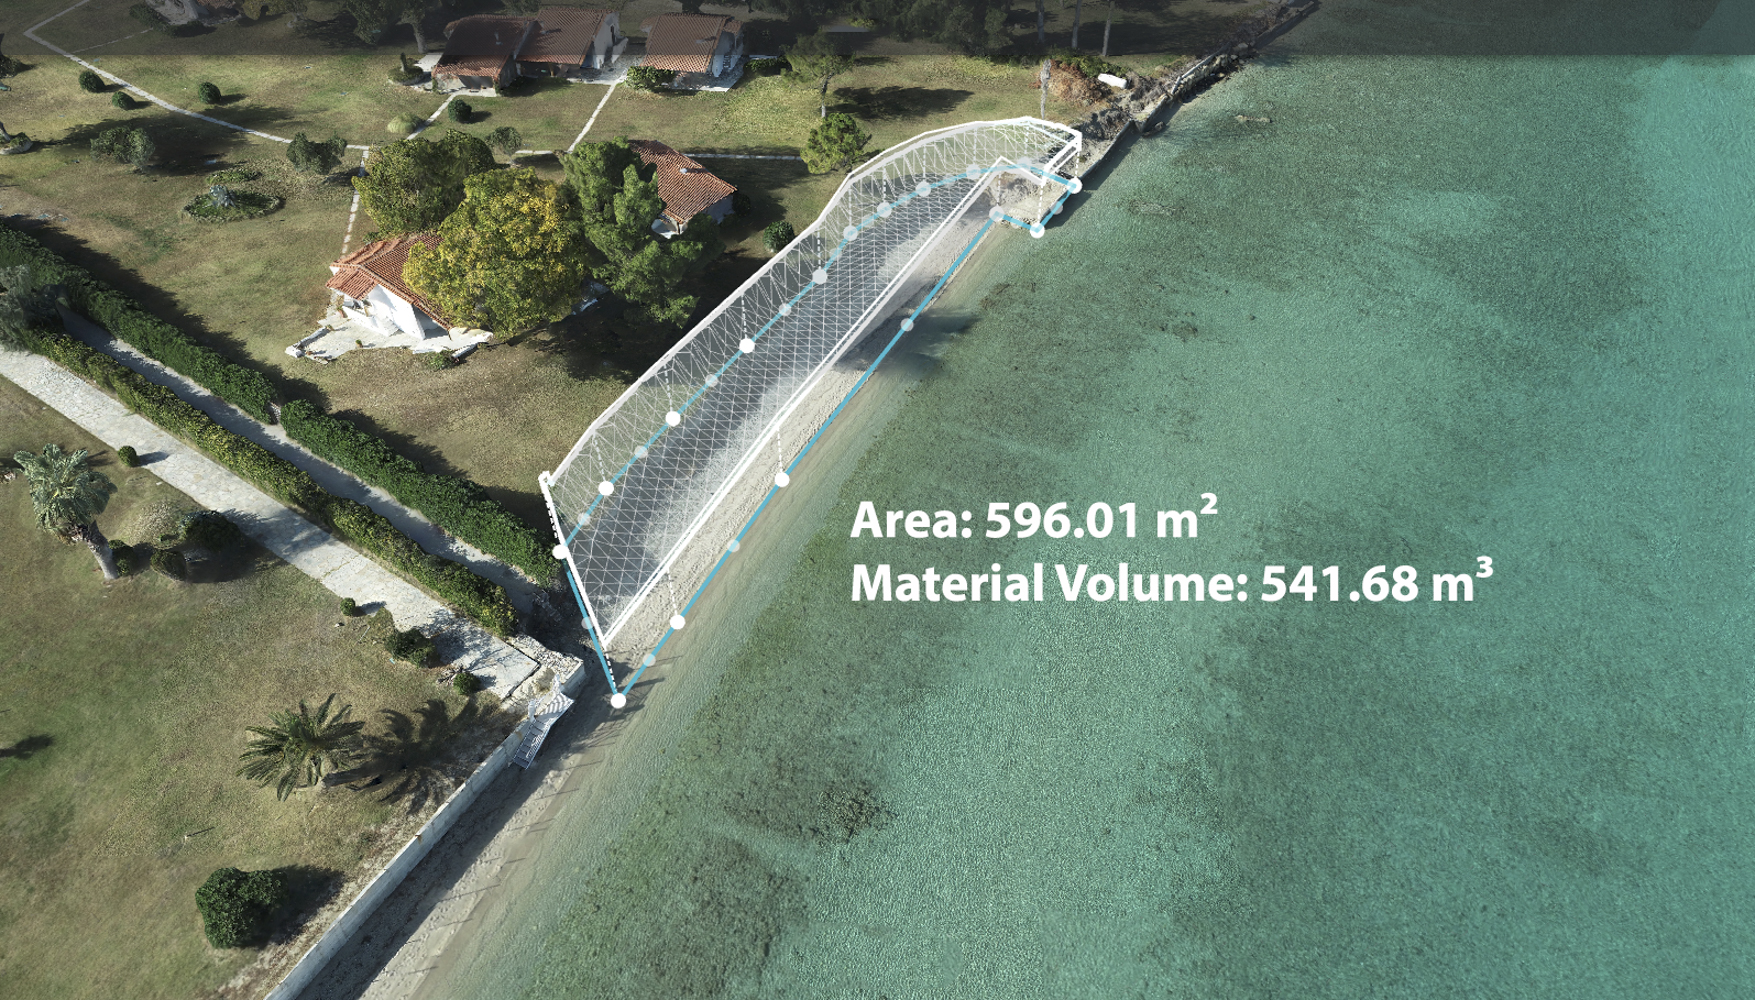
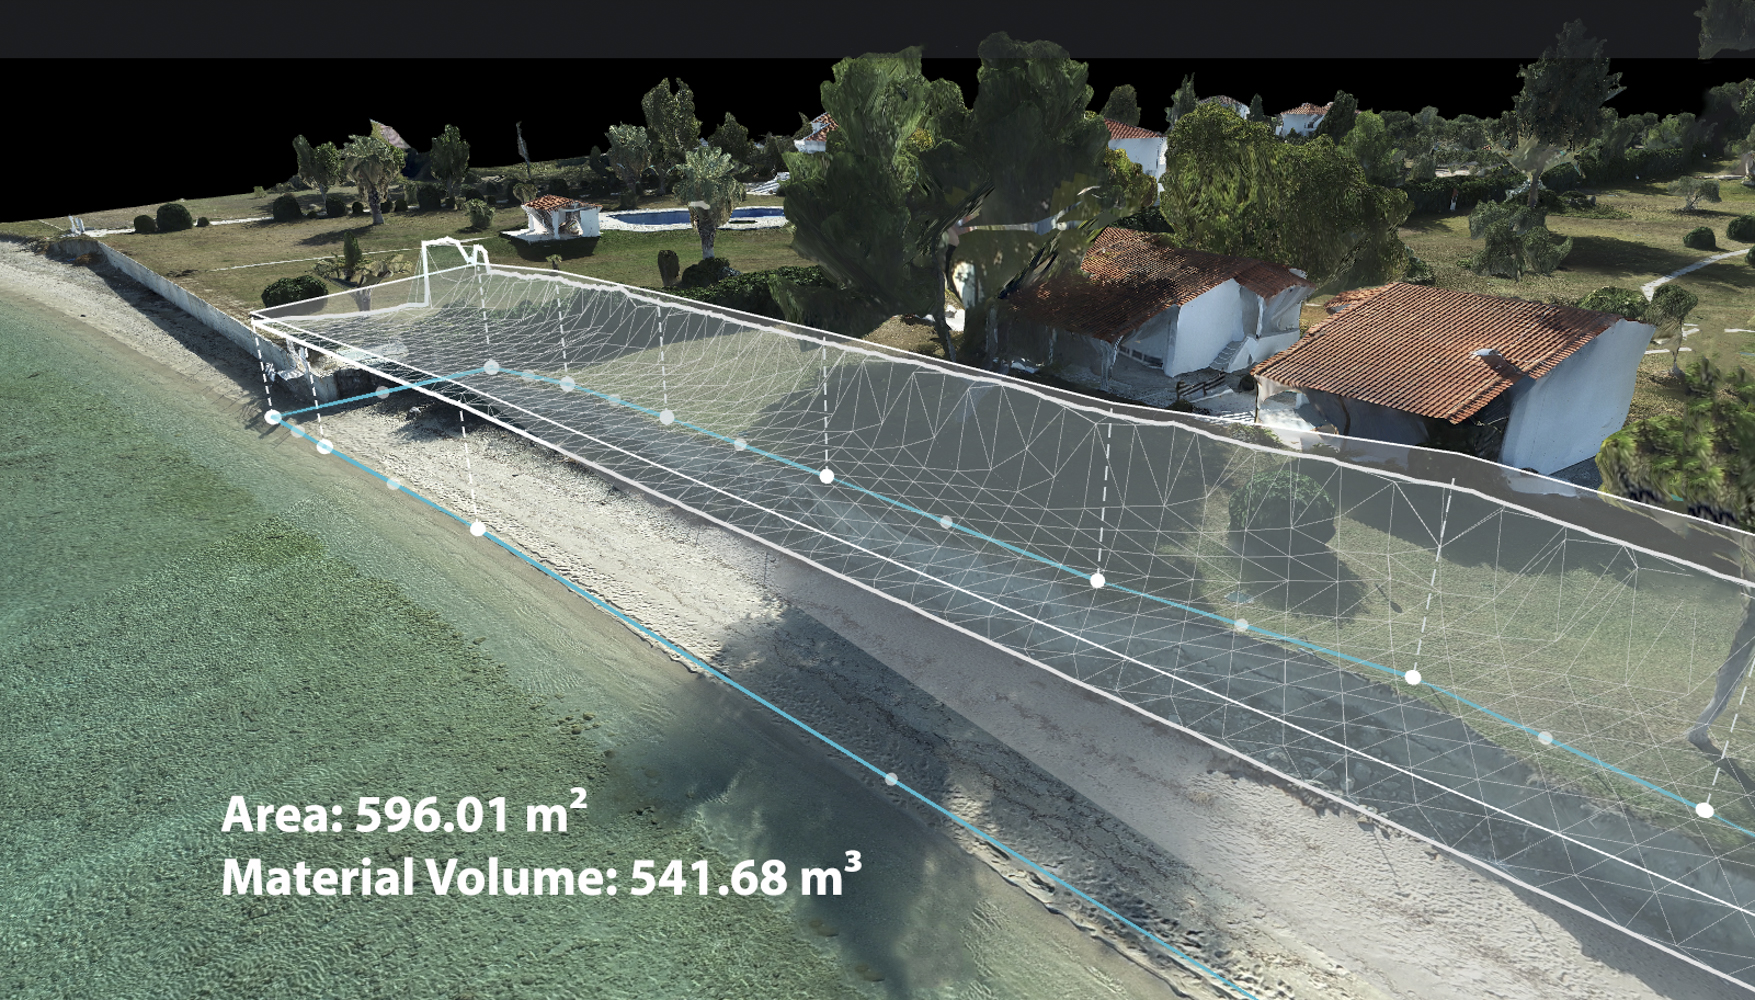
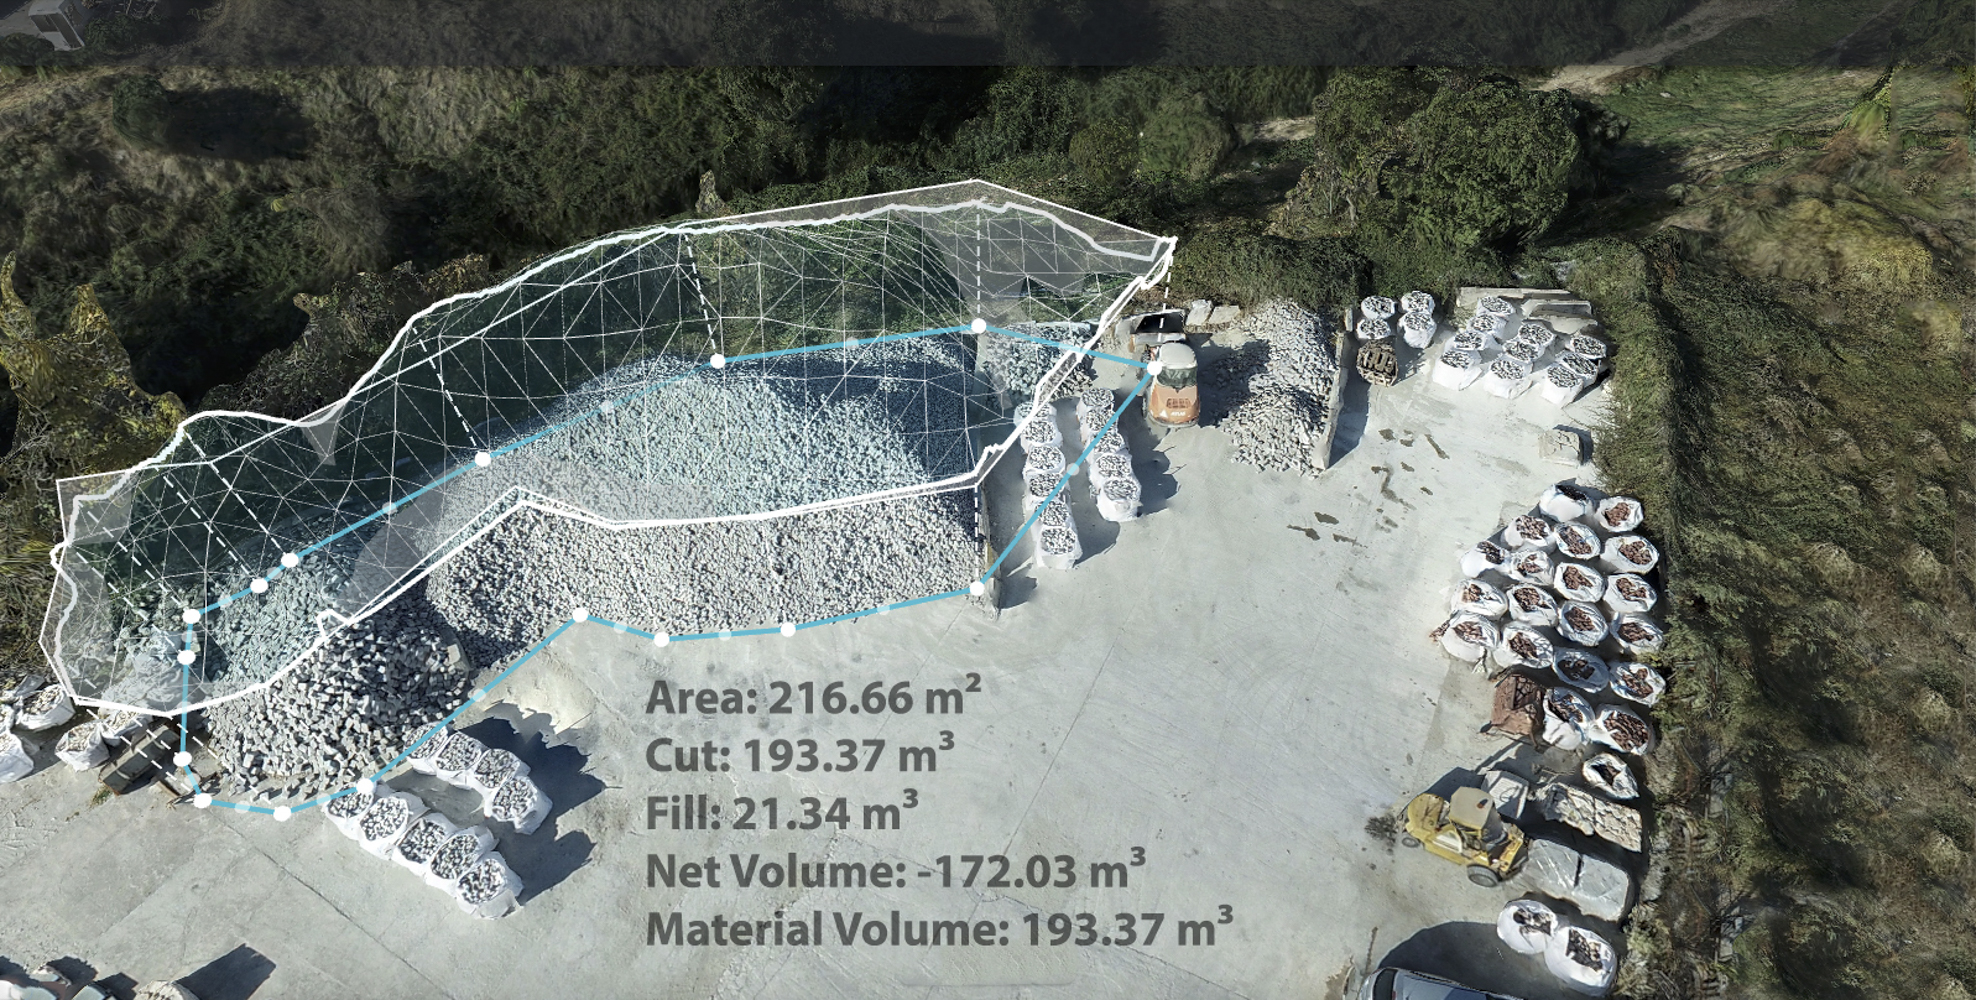
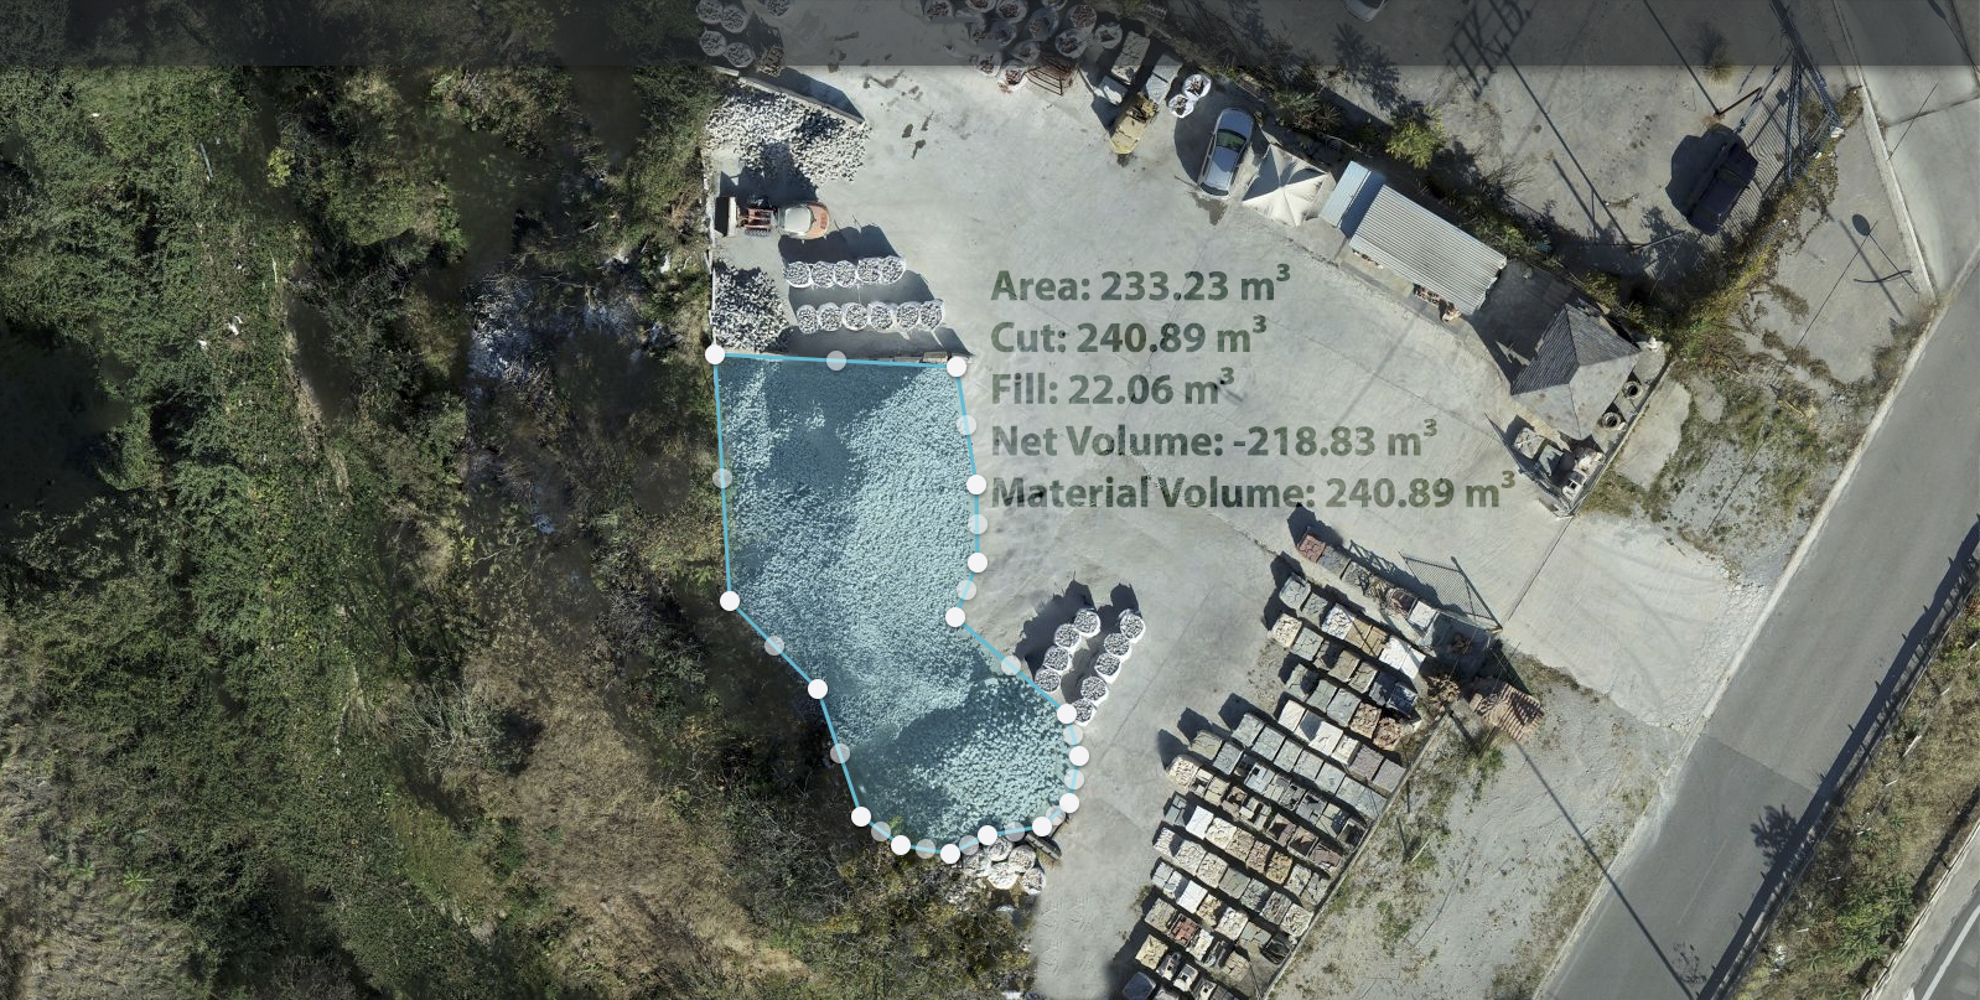
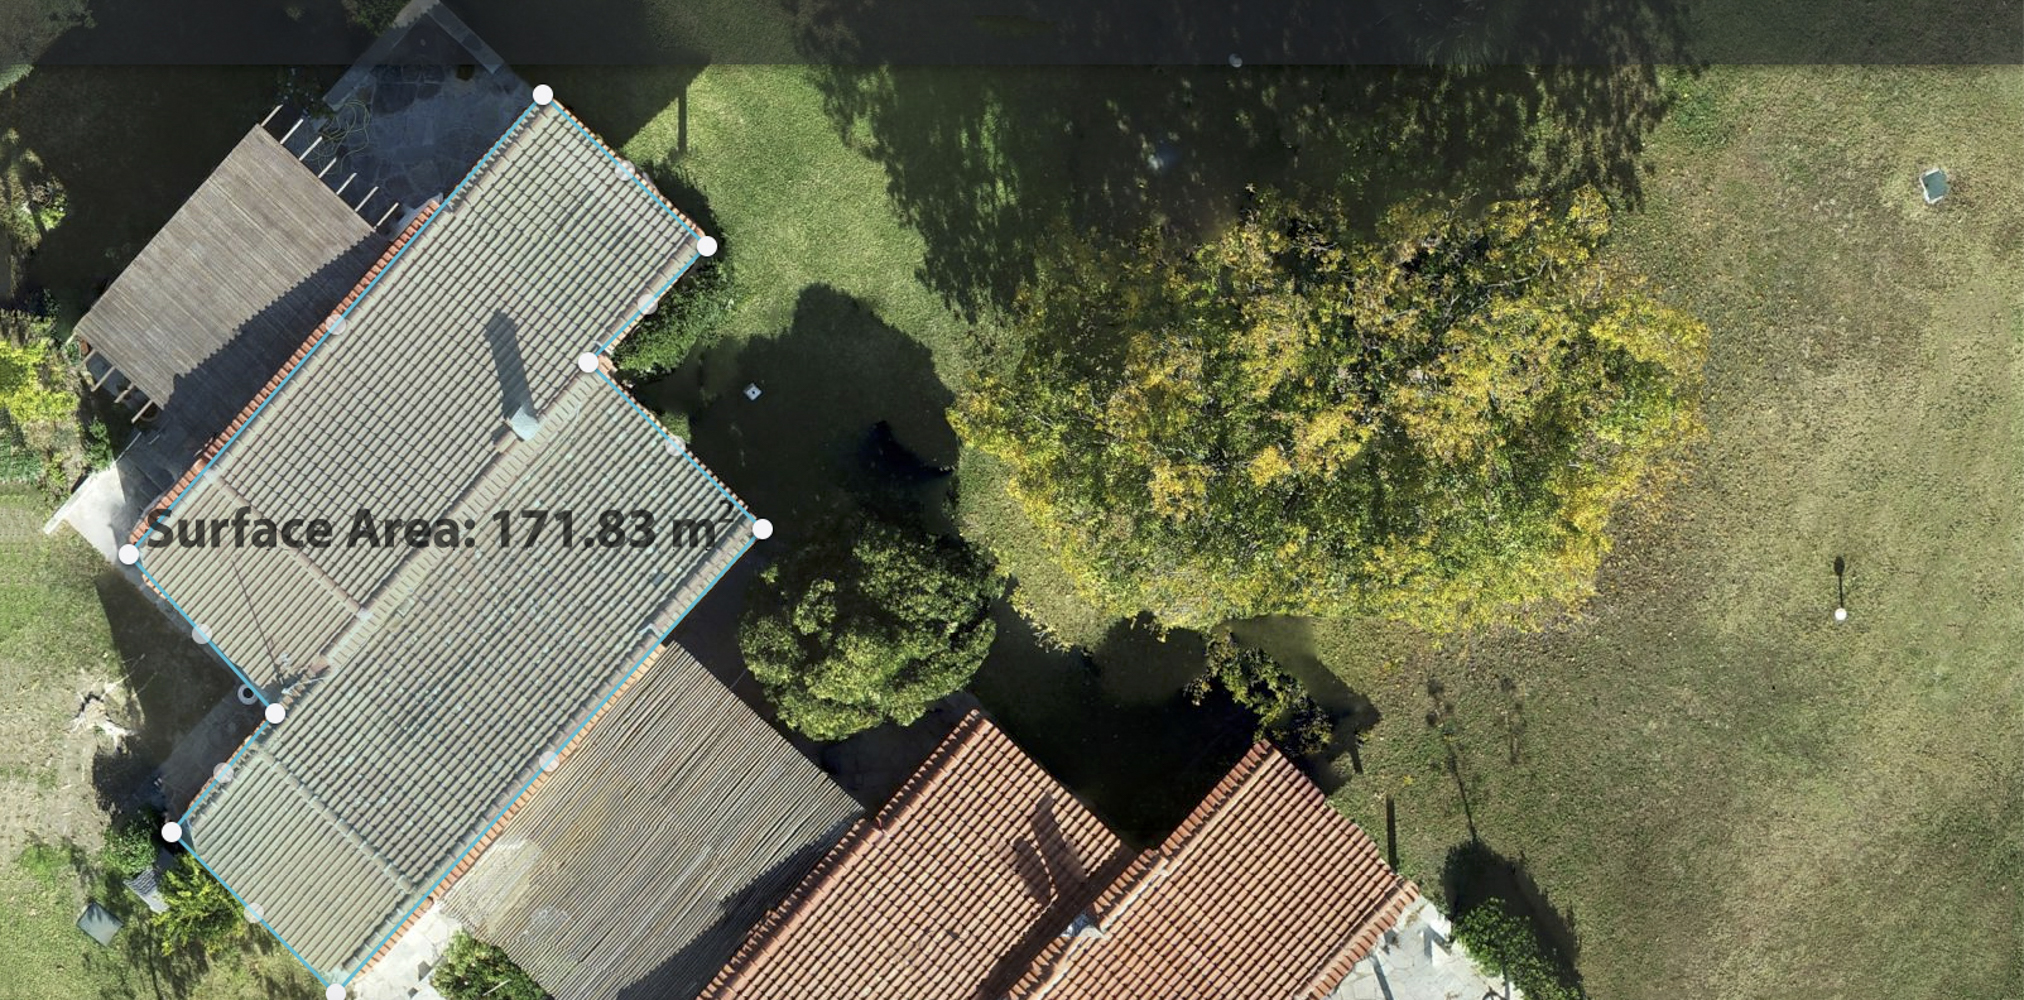
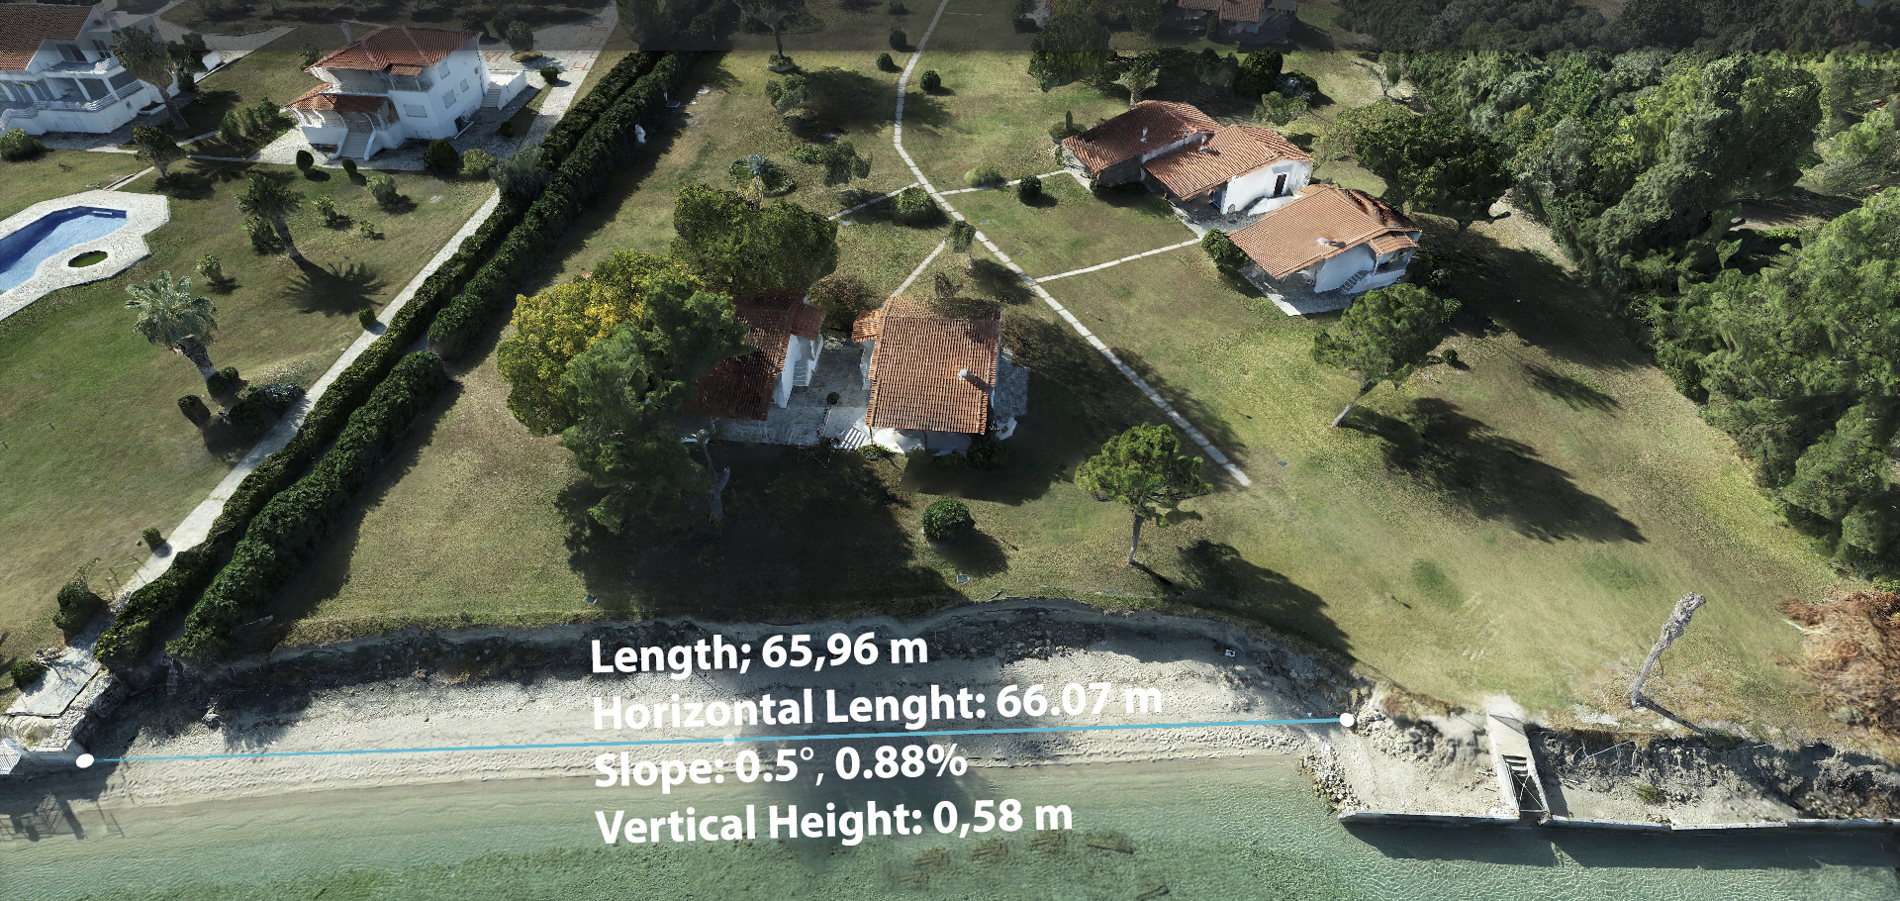
Exampes number 5 - Various Measurements
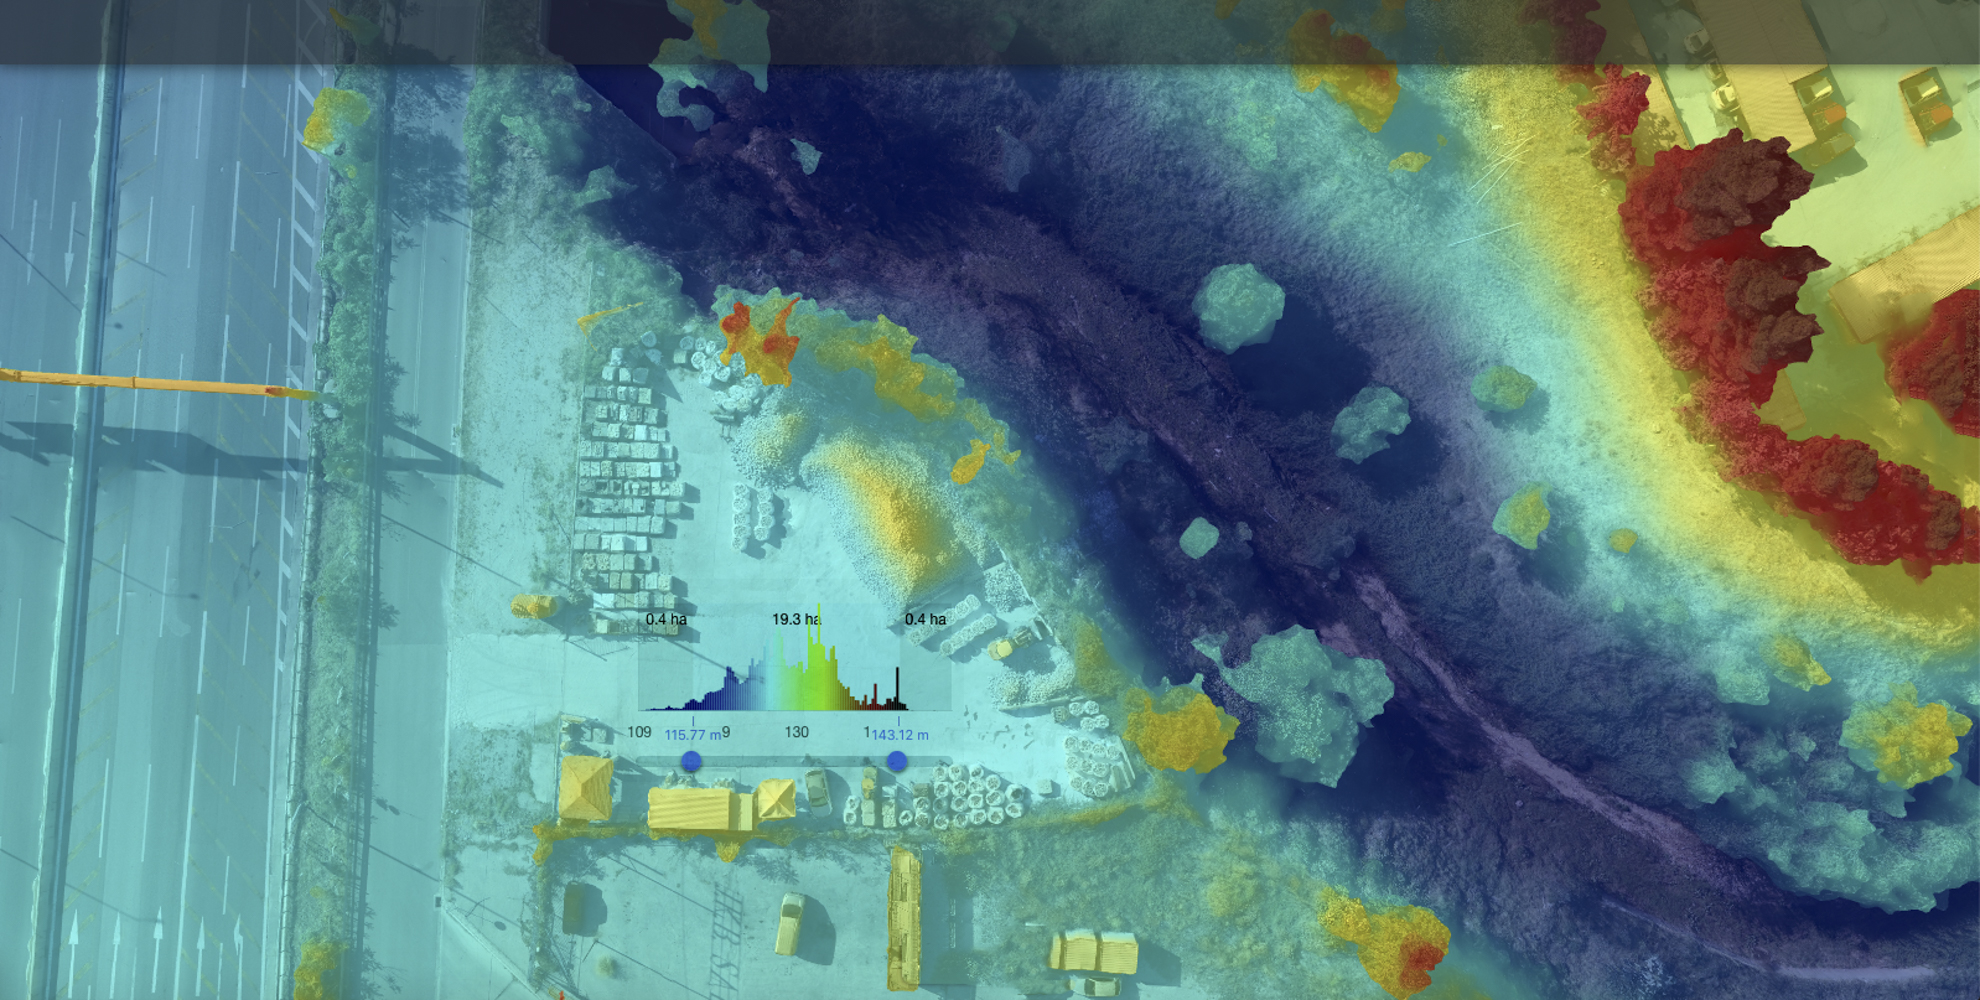
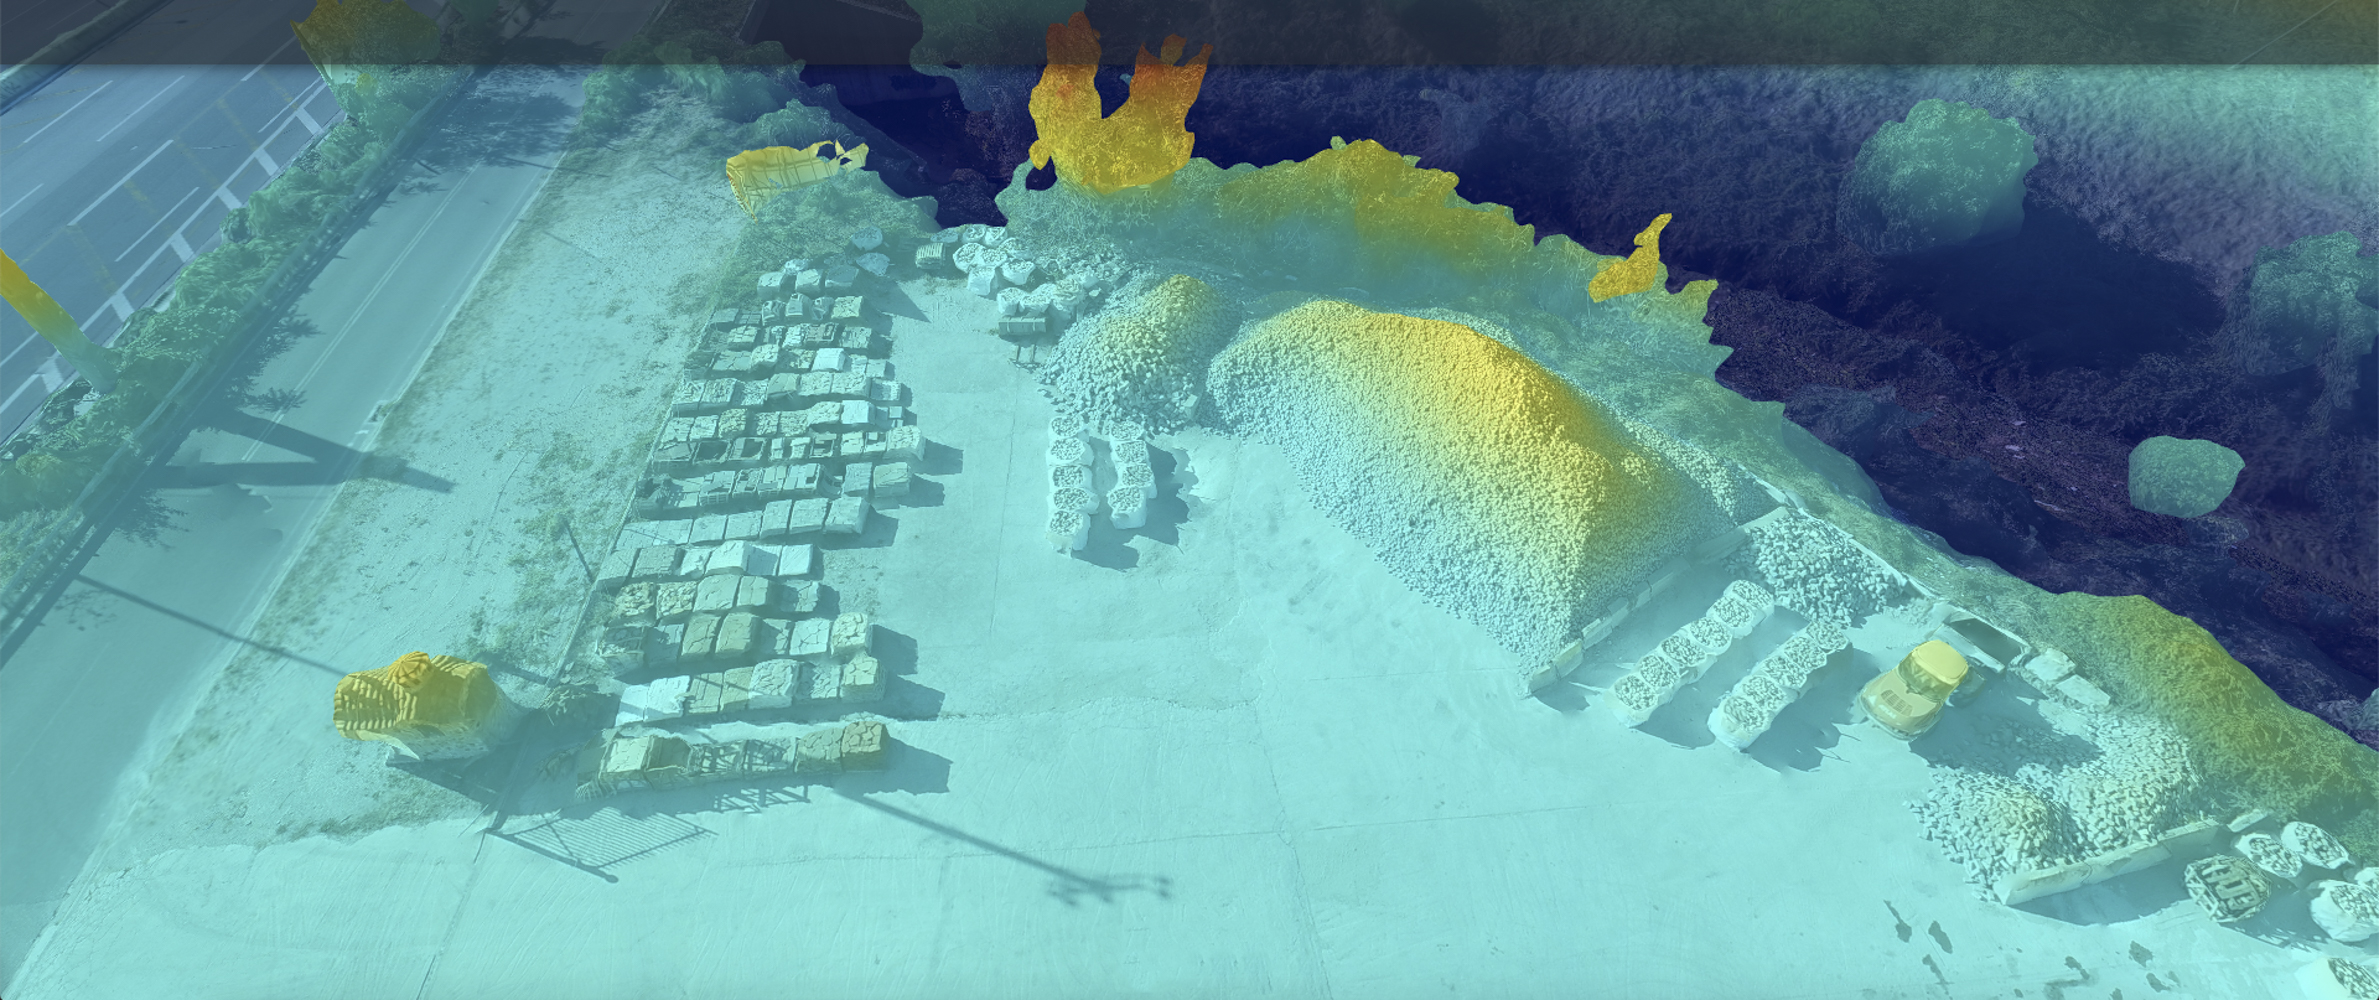
These are some examples that depict more specific types of measurements.
Exampes number 6 - Photography
